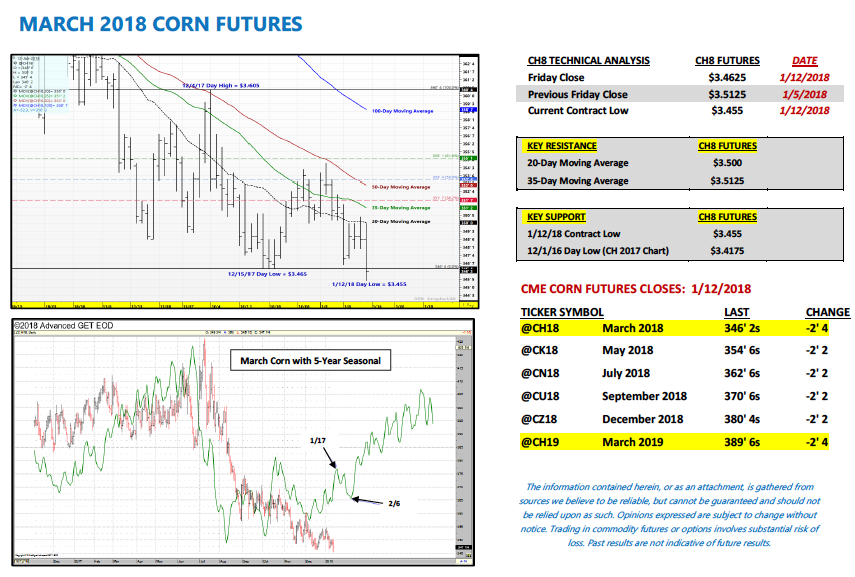
MARCH corn futures closed DOWN 5-CENTS per bushel week-on-week, finishing at $3.46 ¼. The price action continues to frustrate corn bulls.
Will this grinding, painful price action lead to a durable bottom in the months ahead? Let’s look at the latest data.
Weekly Highlights and Takeaways for January 15, 2018:
1. Weekly Export Sales Continue to Disappoint: In Thursday’s Export Sales Summary the USDA reported weekly U.S. corn export sales totaling 17.2 million bushels for the week ending 1/4/2018 (down 54% from the prior 4-week average). Crop year-to-date corn sales improved to 1.067 billion bushels versus 1.431 billion bushels the previous year. The current U.S. corn export sales pace trails 2016/17 by approximately 25%.
In soybeans, weekly export sales totaled just 22.3 million bushels for the week ending 1/4/2018 (down 47% from the prior 4-week average). China was a notable buyer. Crop year-to-date soybean sales increased to 1.523 billion bushels versus 1.776 billion bushels the previous year. The current U.S. soybean export sales pace is off approximately 14% from 2016/17.
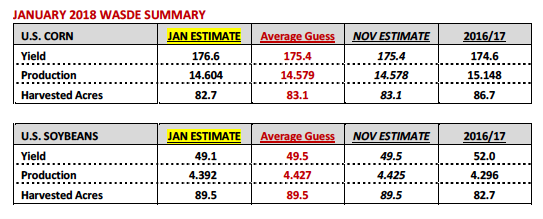
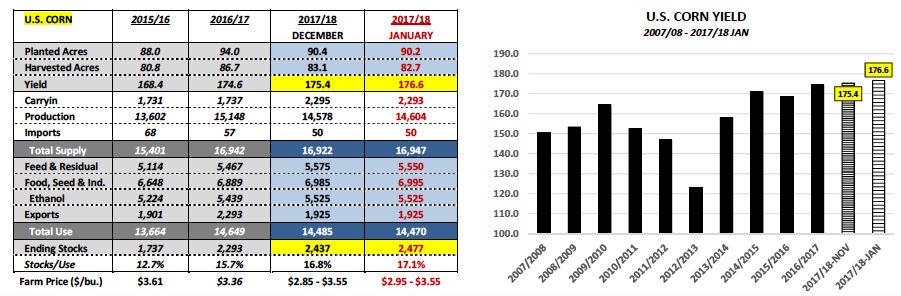
2. U.S. Corn and Soybean Ending Stocks Move Higher in January WASDE: On Friday the USDA released its January 2018 WASDE report. In that report the USDA finalized its 2017/18 production figures for both U.S. corn and soybeans. In corn, the USDA raised its 2017/18 U.S. corn yield projection to 176.6 bushels per acre, up 1.2 bpa from its November forecast. This represented a new record high U.S. corn yield exceeding the previous high-water mark of 175.4 bpa established in 2016/17. Total U.S. corn production improved to 14.6 billion bushels. The net result was a 40 million bushel increase to 2017/18 U.S. corn ending stocks, which climbed to 2.477 billion bushels (30-year high).
In soybeans, the USDA lowered its 2017/18 U.S. soybean yield projection to 49.1 bushels per acre, down 0.4 bpa from its November forecast. Total U.S. soybean production fell to 4.392 billion bushels (still a record high). However the most significant adjustment in soybeans was on the demand side of the balance sheet. The USDA slashed 2017/18 U.S. soybean exports 65 million bushels month-on-month to 2.160 billion bushels. The net result was a 25 million bushel increase to U.S. soybean ending stocks, which improved to 470 million bushels (highest since 2006/07).
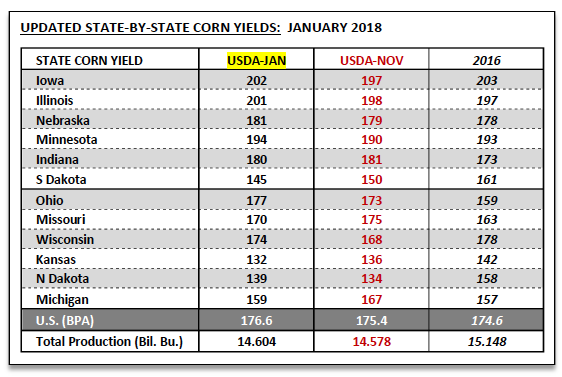
3. Record to Near-Record U.S. Corn Yields Projected in Several Key Corn Producing States: In the January Crop Production report the USDA raised its state corn yield estimates in 7 out of the top 12 corn producing states versus its previous projections in November. Illinois’s state corn yield improved to a new record high 201 bpa versus its previous record high from 2016/17 of 197 bpa. Illinois’s state corn production was reported at 2.201 billion bushels, accounting for 15.1% of total U.S. corn production. Minnesota also achieved a record state corn yield in 2017 of 194 bpa. This was 1 bpa better than its previous record high from 2016/17. Minnesota’s state corn production was 1.480 billion bushels, accounting for 10.1% of total U.S. corn production.
Meanwhile Iowa, the largest state corn producer in the U.S., came up just 1 bpa shy of matching its current record high yield. Iowa’s 2017 state corn yield was reported at a very impressive 202 bpa versus 203 bpa in 2016/17. Iowa’s state corn production was 2.606 billion bushels, equating to 17.8% of total U.S. corn production. And finally….Nebraska’s 2017 state corn yield was finalized at 181 bpa, second best ever trailing only its yield from 2015 of 185 bpa. Nebraska’s state corn production was 1.683 billion bushels or 11.5% of total U.S. corn production.
Therefore to summarize, the top 4 U.S. corn producers in the country enjoyed either a record state yield in 2017 or their 2nd best yield ever. Collectively…Iowa, Illinois, Nebraska, and Minnesota produced 7.970 billion bushels (or 54.6% of the U.S. corn crop). To put this in perspective the 2nd largest World corn producer China produced 8.5 billion bushels in 2017/18. The 3rd largest World producer Brazil is currently forecasted to produce 3.74 billion bushels.
4. World Corn and Soybean Stocks Move Higher in January WASDE: 2017/18 World corn ending stocks improved to 206.57 MMT in the January WASDE report versus 204.08 MMT in December and 228.75 MMT in 2016/17. Specifically, Brazil’s corn production forecast was left unchanged at 95 MMT as was Argentina’s at 42.0 MMT. Therefore despite continued speculation that Argentina’s corn crop is moving backward due to persistently dry weather conditions we have yet to see the USDA make any negative production adjustments to suggest those concerns have been validated. As far as Brazil is concerned, future corn production changes will likely take shape February – May with Brazil just approaching the planting season of its safrinha corn crop, which now accounts for approximately 70% of total Brazil corn production. The market believes there will be a significant reduction in safrinha corn acreage due to Brazil’s soybean harvest in the Center-West region of the country extending into the preferred window for planting safrinha corn (corn is planted after the soybean harvest). Additionally cash prices for corn in Mato Grosso, the largest state producer of safrinha corn, remain below breakeven values for many producers.
Meanwhile 2017/18 World soybean ending stocks inched up slightly month-on-month to 98.57 MMT, still a record high. Minor adjustments were made to South American soybean production. Brazil’s 2017/18 soybean crop was estimated at 110 MMT versus 108 MMT in December and 114.1 MMT in 2016/17. 2017/18 Argentina soybean production was estimated at 56 MMT versus 57 MMT in December and 57.8 MMT in 2016/17. China’s soybean imports for 2017/18 were left unchanged at 97 MMT versus 93.5 MMT in 2016/17. China represents 65% of total World soybean imports.
MARCH CORN FUTURES PRICE FORECAST:
The market fundamentals in corn remain burdensome. I fully expect March corn futures to continue trading in a narrow range ($3.40 – $3.55) into the first week of February, which is consistent with the 5-year price seasonal. Until traders can shift gears and focus on 2018 U.S. corn production prospects, the massive 2017/18 U.S. corn carryout will likely provide continuing overhead price resistance at both the 50-day ($3.53) and 100-day ($3.587) moving averages. That said…I am not bearish below $3.40 CH8.
Twitter: @MarcusLudtke
Author hedges corn futures and may have a position at the time of publication. Any opinions expressed herein are solely those of the author, and do not in any way represent the views or opinions of any other person or entity.
Data References:
- USDA United States Department of Ag
- EIA Energy Information Association
- NASS National Agricultural Statistics Service

: Worrisome to Broader Market?")


