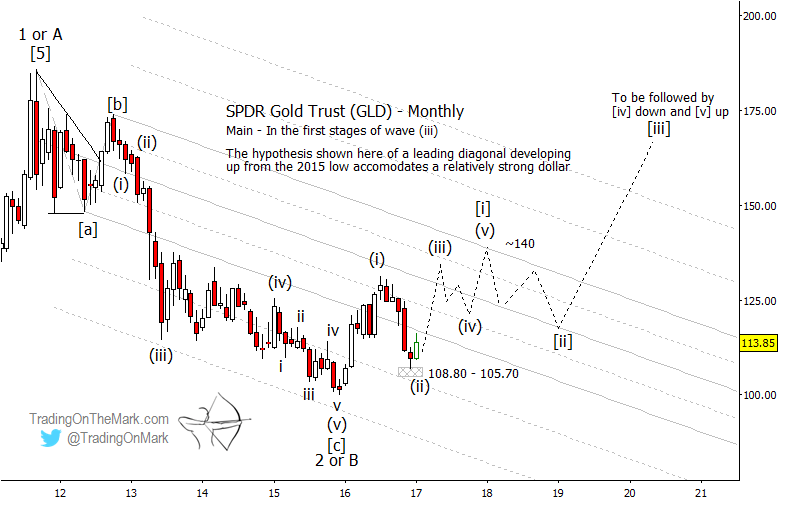
The Gold Market Is Getting Complacent: Watch This Chart!
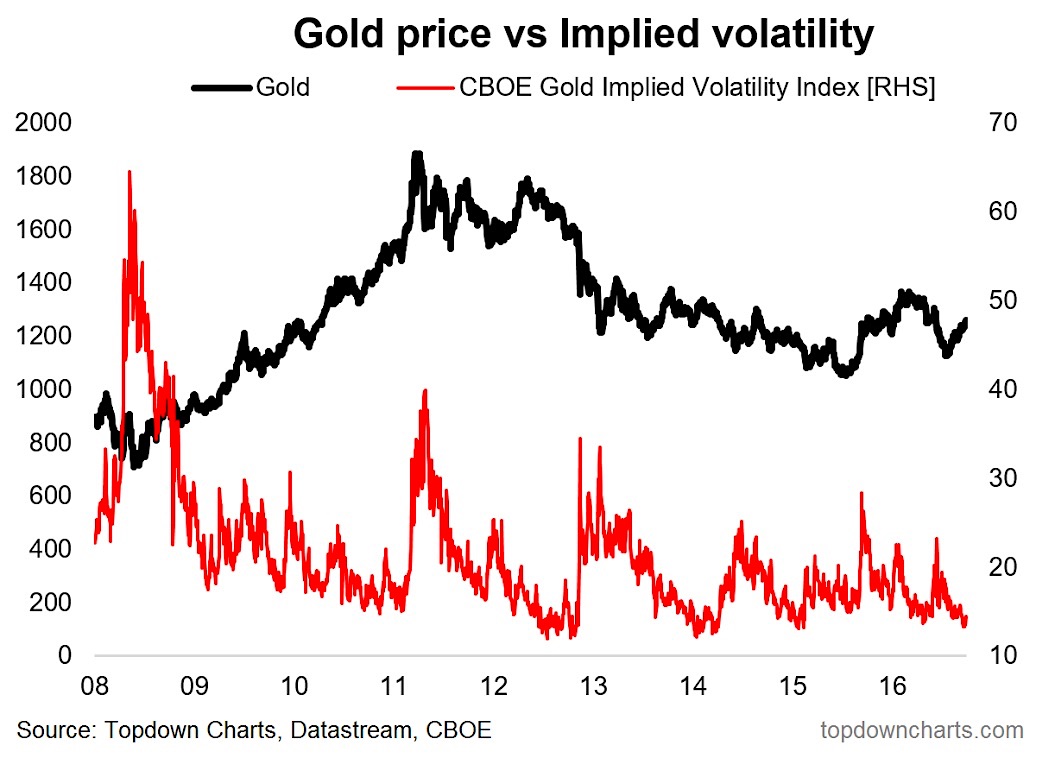
A little too quiet for Gold...
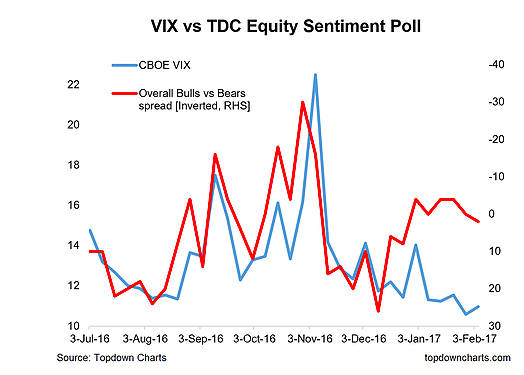
Gold came to my attention for a couple of reasons this week. First was the sentiment signals in the latest...
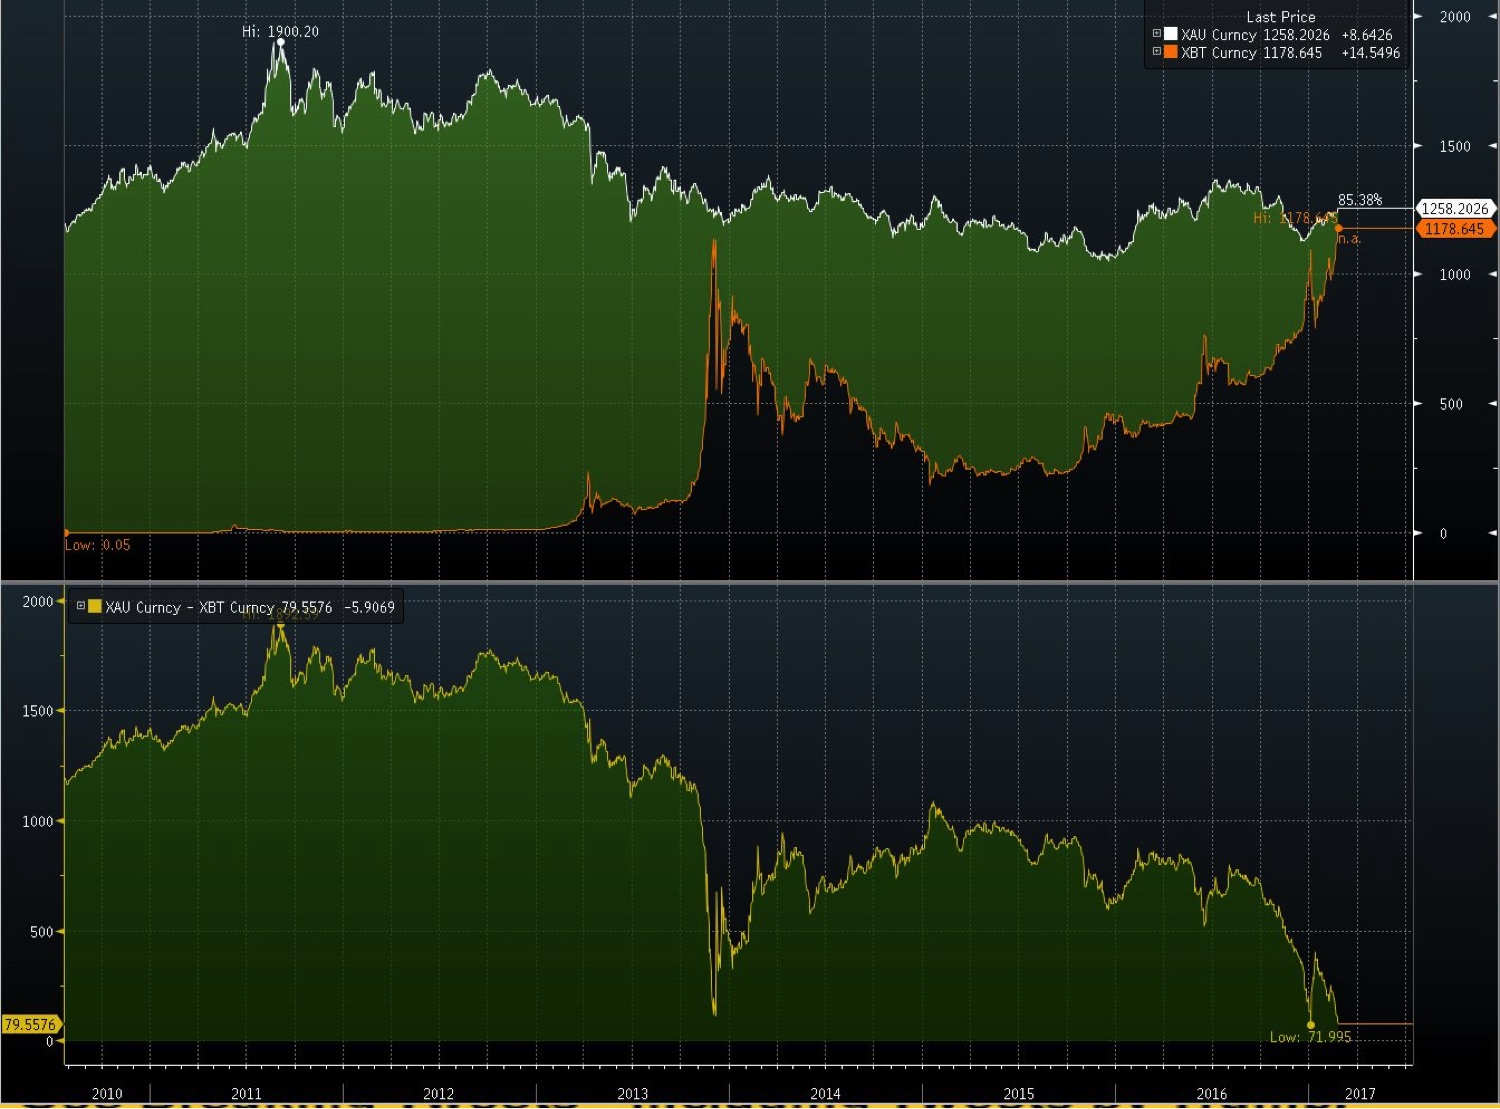
Bitcoin Trades Near Parity With Gold (chart spotlight)
While Gold (NYSEACA:GLD) has been on a tear in 2017. But as Bloomberg noted last week, Bitcoin is closing the gap!
Gold is trading at...
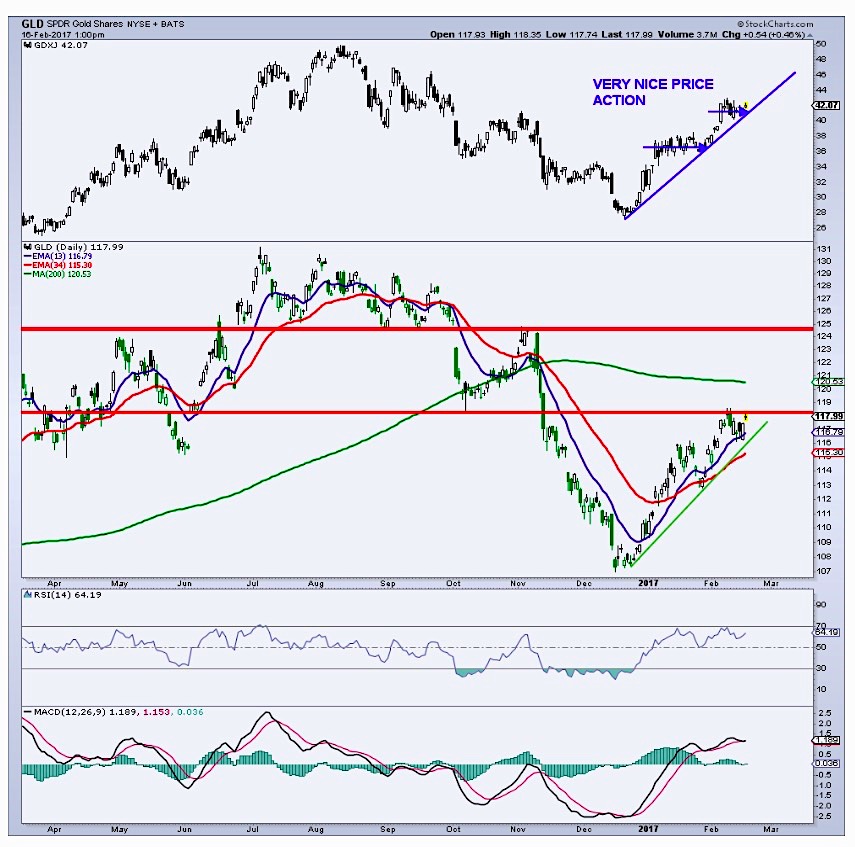
Gold Chart Update: Bulls Look To Power Through Resistance
After a second wave higher in the 2017 rally, gold prices spent much of last week trading in consolidation mode.
Although the backdrop is bullish,...
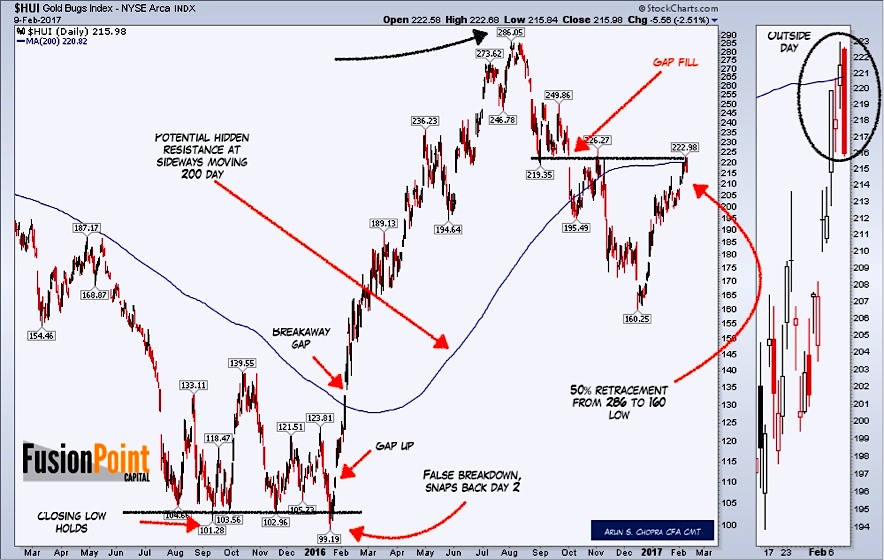
Gold Miners (GDX): Gold Bugs May Not Be Immune Here
A key driver for gold prices (NYSEARCA:GLD) in early 2016 was Japanese negative interest rate policy rolled out at the end of January (note...
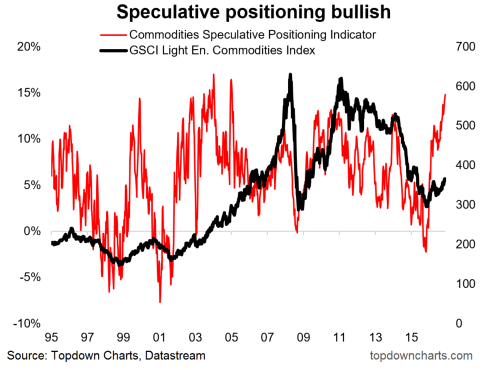
Commodities Speculative Positioning At 10 Year High
The below chart shows average speculative futures positioning (standardized against open interest*) across 15 different commodities - giving effectively an asset class view for...
5 Global Charts For Active Investors – February 7
It’s time for another round of macro technical charts as investors move further into the month of February (including stock market indices, sectors, individual commodities,...
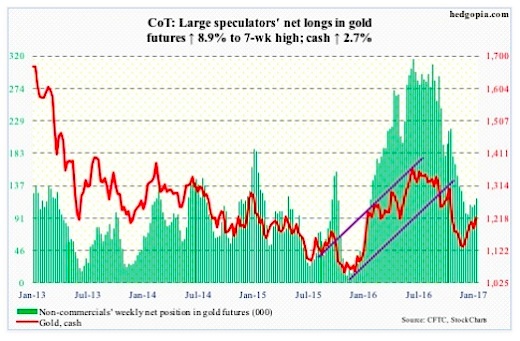
3 COT Report Charts For Commodities Traders (Feb 3)
The following is a recap of the February 3 Commitment of Traders Report (COT) released by the CFTC (Commodity Futures Trading Commission) looking at...
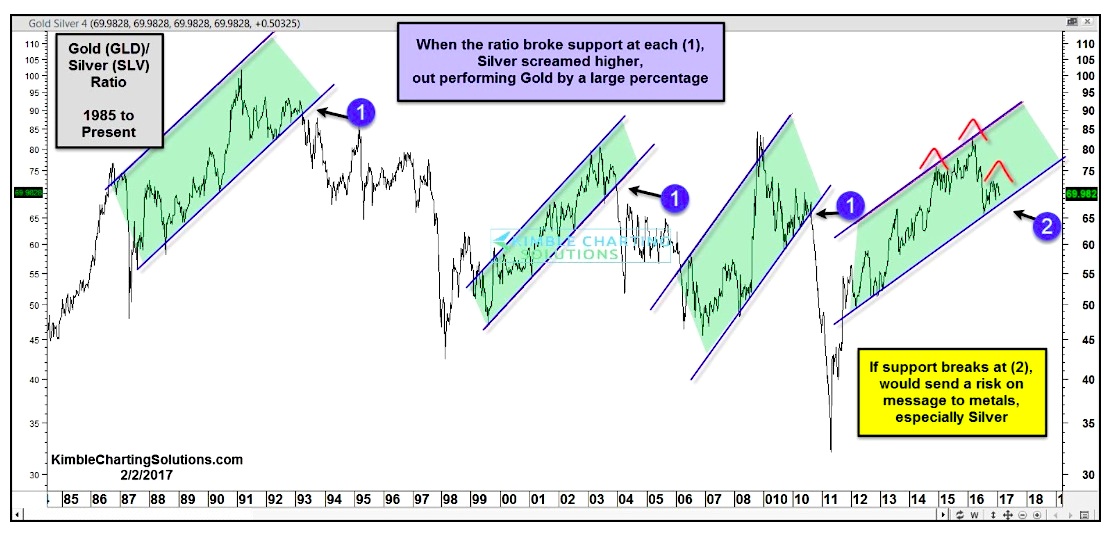
Gold To Silver Ratio At Critical Juncture Historically
One chart that provides a good indicator for precious metals followers is the Gold to Silver ratio.
Below is a chart looking at the ratio...
Gold Update (GLD): 2 Elliott Wave Scenarios To Consider
It was late August when we suggested that See It Market readers should watch for a pullback in gold prices. In subsequent months, shares...
5 Charts For Traders: Gold, US Dollar, CBOE SKEW and More
It’s time for another set of 5 macro technical charts to watch as we move toward the end of January (including stock market indices, sectors, individual...

