It’s time for another set of 5 macro technical charts to watch as we move toward the end of January (including stock market indices, sectors, individual commodities, currencies, bonds, and other benchmarks and market indicators).
This chart review will look at technical price developments. And even if you’re not technical analysis minded I believe that it’s a useful way to stay on top of global market trends across the main financial markets. You can also use this chart analysis as a prompt for further analysis and investigation…
Today we look at charts of 10 Year Treasury Yield (INDEXCBOE:TNX), US Dollar Index (CURRENCY:USD), Gold (NYSEARCA:GLD), S&P 500 SKEW, and the Australian Dollar – AUDUSD (CURRENCY:AUD).
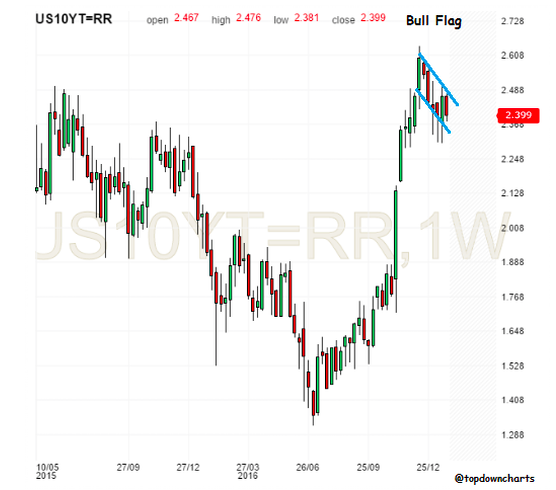
1. US 10 Year Treasury Yield – Bull Flag
There’s a “bull flag” spotted on the US 10 year treasury yield chart; this is a bullish continuation pattern. The measure rule for a bull flag is that the flag (which slopes against the trend) appears “half way up the flag pole” thus if you say the move started at 1.35% and you get a breakout at say 2.50% that would imply a target move of 115bps to a target yield of 3.65%.
Yield is currently trading around its 50-day moving average and RSI has reset to below 50 from extreme overbought levels. Risk management point is 2.30% – a clean break down through the 50 day moving average and through 2.30% will quickly switch the bias from rising to falling yields. Again, 2.60% is the critical level on the upside and will provide confirmation to any upside break from the bull flag.
Overall technical view: Bias is to expect rising yields, watch for an upside break of the bull flag continuation pattern.
Next Chart (US Dollar)…


