4. S&P 500 Index – Ex-SKEW-sme
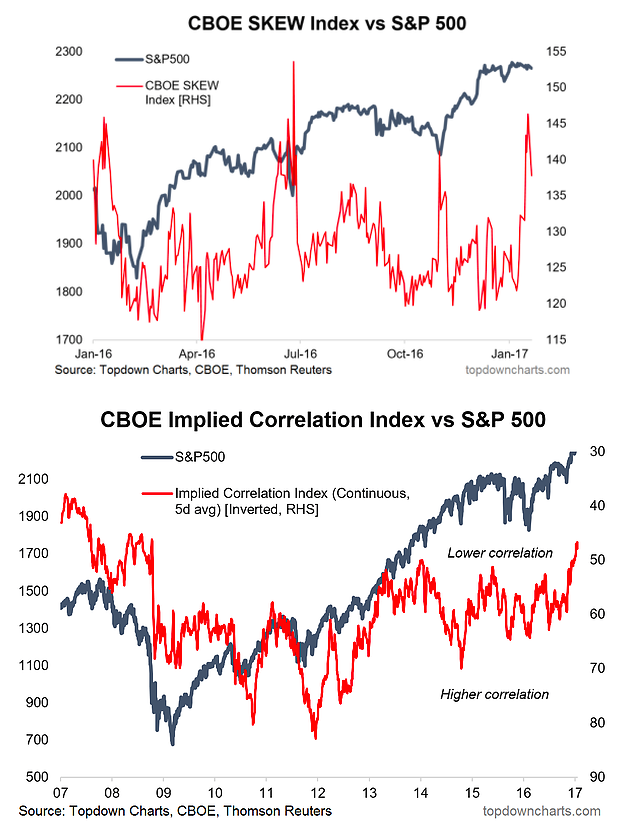
SKEW is a measure of tail risk hedging demand, present levels indicate high demand for tail risk hedges and high implied probability of long-tail outcomes. The chart shows that SKEW has spiked into the major market bottoms of the past year; so it was not smart money as such (in hindsight). If we assumed the same were to happen again you’d be calling for a move higher. This time however there is no real event risk unless you count the inauguration…
On the other hand, a somewhat similar index, the CBOE option implied correlation index, shows falling correlations which has actually been a bad sign historically. I talked about the implied correlation index in the Dec-9-2016 edition of the Weekly Macro Themes — let me know if you want a copy or a trial). Overall technical view: Mixed signals from these alternative CBOE options driven indexes, but somewhat cautionary on balance
Next Chart (AUDUSD)…


