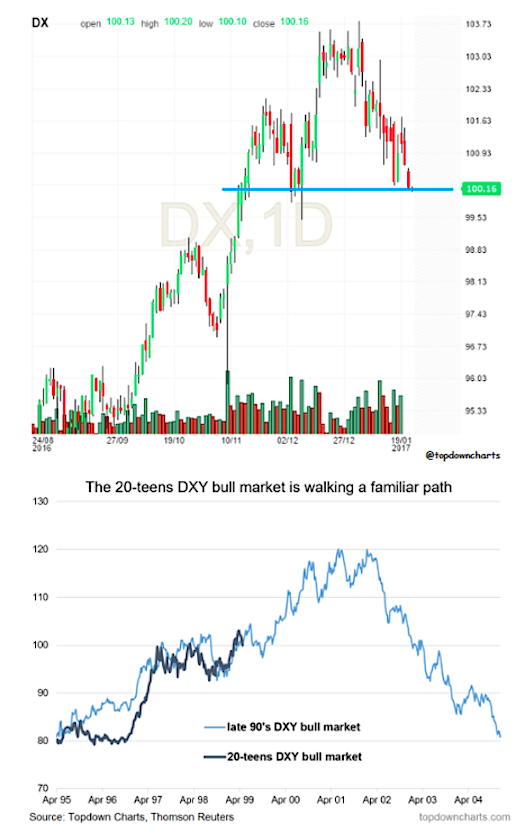
2. US Dollar Index – 100 reasons to buy and sell
100 is the critical level for the US Dollar; this support line if broken will probably open up a move back to the bottom of the range around 95. Looking at the analog chart (which appeared in a previous edition of the Weekly Macro Themes) one key takeaway is that it’s not uncommon for the DXY to under go big-league corrections in the order of 7 points during a bull market.
One thing to watch for will be a possible head and shoulders top as we already have a left shoulder, a head, and a clearly defined and meaningful neckline. Overall technical view: Cautious; break of the 100 will see an extension of the correction
Next Chart (Gold futures)…


