A key driver for gold prices (NYSEARCA:GLD) in early 2016 was Japanese negative interest rate policy rolled out at the end of January (note the sharp up move in the Gold Bugs chart below by my colleague Arun Chopra CFA CMT).
After the Bank of Japan refused to go further into NIRP in summer 2016, and after Brexit, rates rose globally punishing the yellow metal and gold miners (NYSEARCA:GDX) in the second half of the year.
We’ve seen a rebound in early 2017 as rates have slowed their ascension. Other factors in play include rising populism and protectionism globally (Euro elections this year), prospective inflation from new fiscal stimulus and tax cuts, and of course the ‘Indomitable Dollar’.
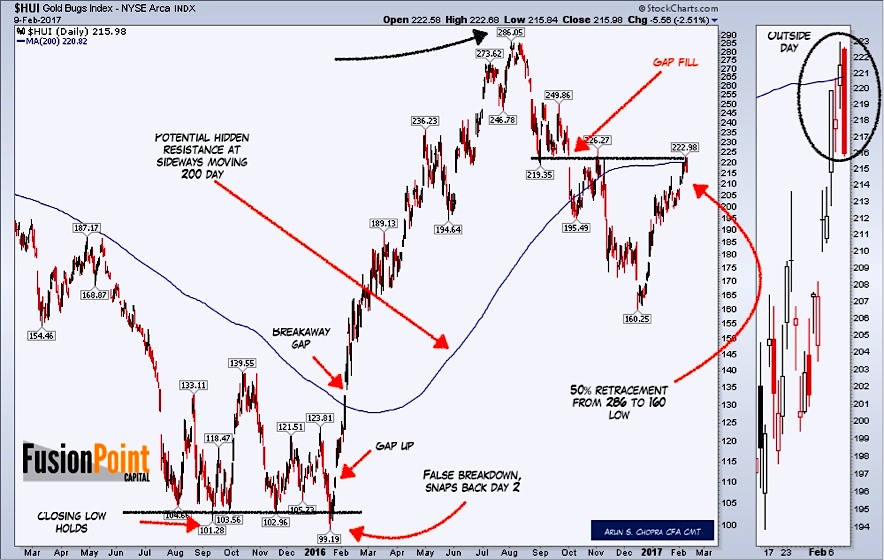
Gold Bugs Index Chart (INDEXNYSEGIS:HUI)
From a pure trading perspective, Arun put out a chart to members Thursday that may give some pause to the overwhelming bullish consensus at present. I summarize his technical points below
- The Gold Bugs Index (HUI) had an outside, Thursday, Feb. 9th at the gap fill and resistance level.
- There is also potential resistance from the sideways 200MA.
- And the Bugs index is at 50% retracement of the 286 to 160 low move.
The excitement in gold and the miners over the past week, and indeed month, have a trio of short term technical issues to contend with. We’ll see how it plays out.
Thanks for reading.
Jason B. Leach, CFA, Research Director, Head of Macro, Fusion Point Capital @JBL73
Chart by Arun Chopra, Founder and Chief Market Technician, Fusion Point Capital @FusionPointCapital
The authors may have positions in mentioned securities by the time of publication. Any opinions expressed herein are solely those of the author, and do not in any way represent the views or opinions of any other person or entity.


