It’s time for another round of macro technical charts as investors move further into the month of February (including stock market indices, sectors, individual commodities, currencies, bonds, and other benchmarks and market indicators).
This chart review will look at 5 charts with key technical price developments. Even if you’re not technical analysis minded, I believe that it’s a useful way to stay on top of global market trends across the major financial markets. You can also use this chart analysis as a prompt for further analysis and investigation…
In this edition we Copper’s latest rallyl, a symmetrical triangle on US Treasuries (INDEXCBOE:TNX), key resistance on Indian equities, a closer look at the rally in Gold (NYSEARCA:GLD), and an awfully quiet VIX (INDEXCBOE:VIX).
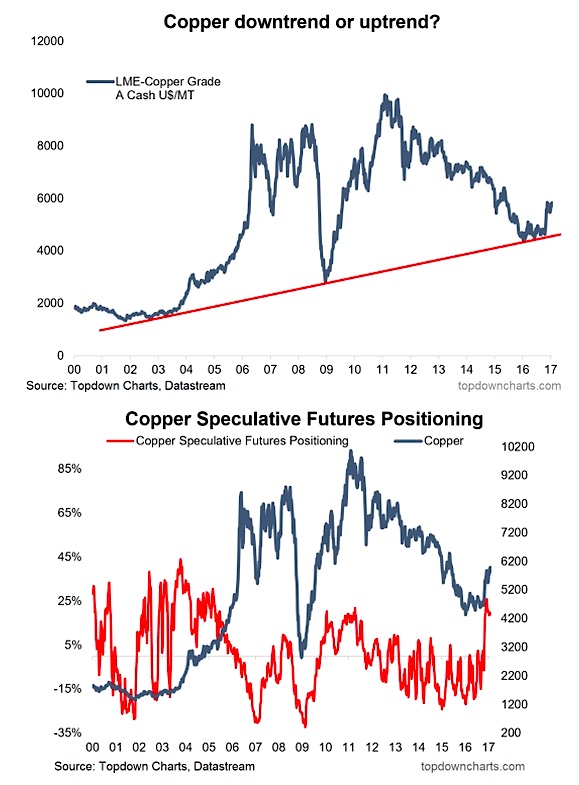
1. Copper – Is it really in an uptrend?
Looking at the past 5 years and it appears that copper is in a downtrend. But looking at the past 15 years for copper and Copper appears to be in an uptrend with touches of the trendline in 2003, 2008, and 2016; each interpretation has a very different meaning for the outlook.
Speculative futures positioning looks stretched, but in the same way as in the early 2000’s. I talked about this and the outlook for base metals in the latest edition of the Weekly Macro Themes.
Overall technical view: Bullish bias medium-long term horizon.
NEXT CHART (10 Year Treasury Yield)…


