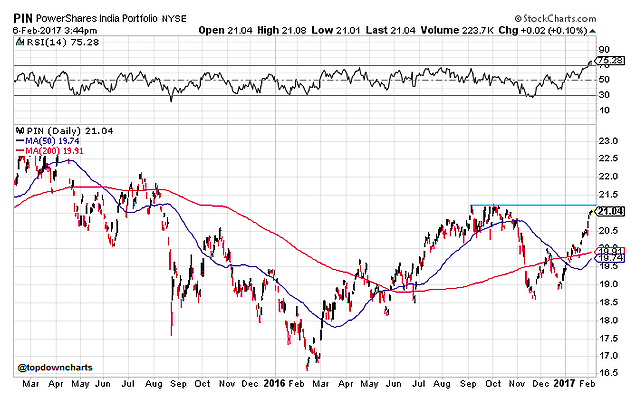
3. Indian Equities – Overbought against resistance
Indian equities look short-term overbought with the RSI indicator above 70 following a sharp rise. At the same time, price is coming up against resistance. The 50 day moving average is coming close to crossing over the 200 day moving average (a golden cross) and such a signal is common during the start of a new uptrend.
Overall technical view: Short-term cautious given proximity to resistance and overbought signals, but a breakout would signal the start of a new uptrend and bull market.
NEXT CHART (Gold Prices)…


