4. Gold – Resistance?
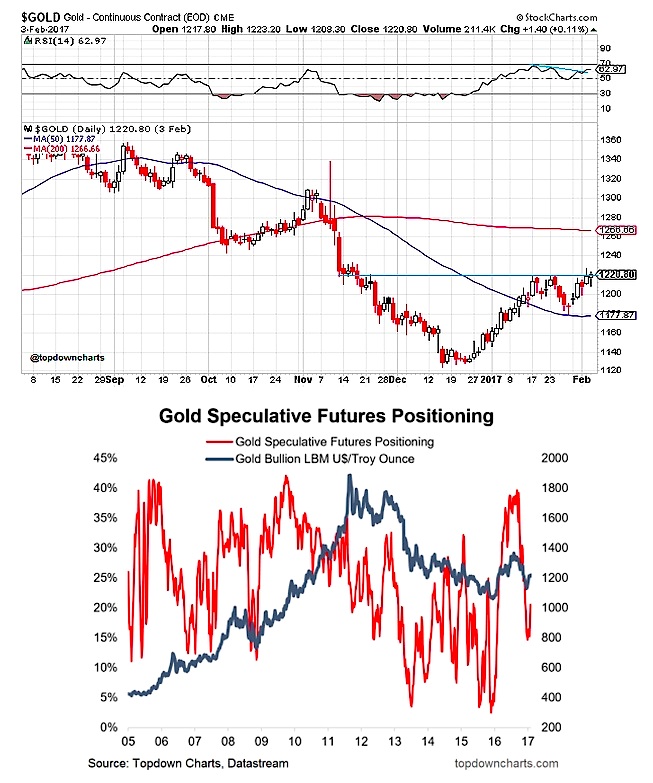
Gold looks to be in the process of breaking out through the 1220 resistance point. The RSI indicator also appears to have snapped its brief bout of bearish divergence. A successful breakout will put the 200 day moving average in play and potential further move higher.
At the same time speculative positioning is moving higher after putting in a higher low, as also noted in the latest Weekly Macro Themes (which also covered commodities as an asset class). Overall technical view: Bullish bias, but on watch for any signs of a failed breakout.
NEXT CHART (VIX Volatility Index)…


