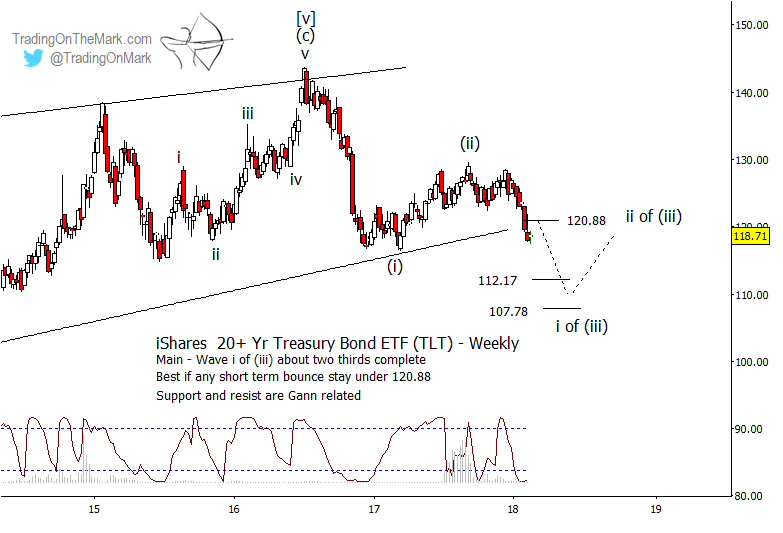
Riding The Downward Trend In US Treasuries
Our Elliott wave forecast for treasury bonds continues to hold up well. In June 2017 we described the minor rally during the first part...
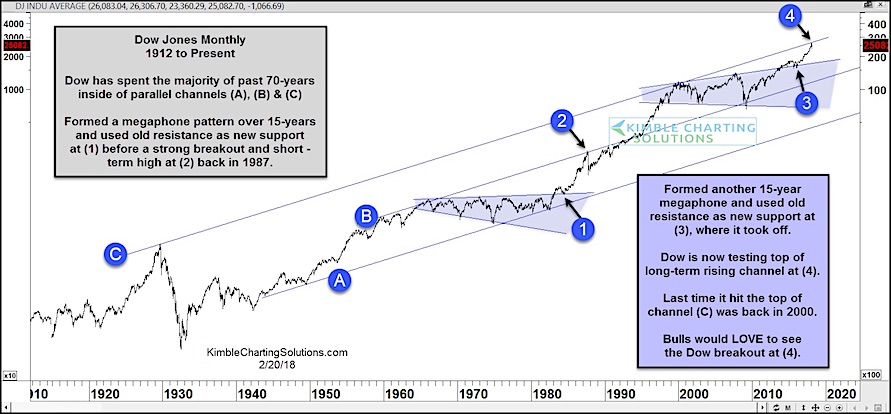
Dow Industrials “Megaphone” Pattern Leads To Major Test!
Back in November, I shared a long-term historical chart of the Dow Jones Industrial Average and pointed out a megaphone pattern breakout that looked...
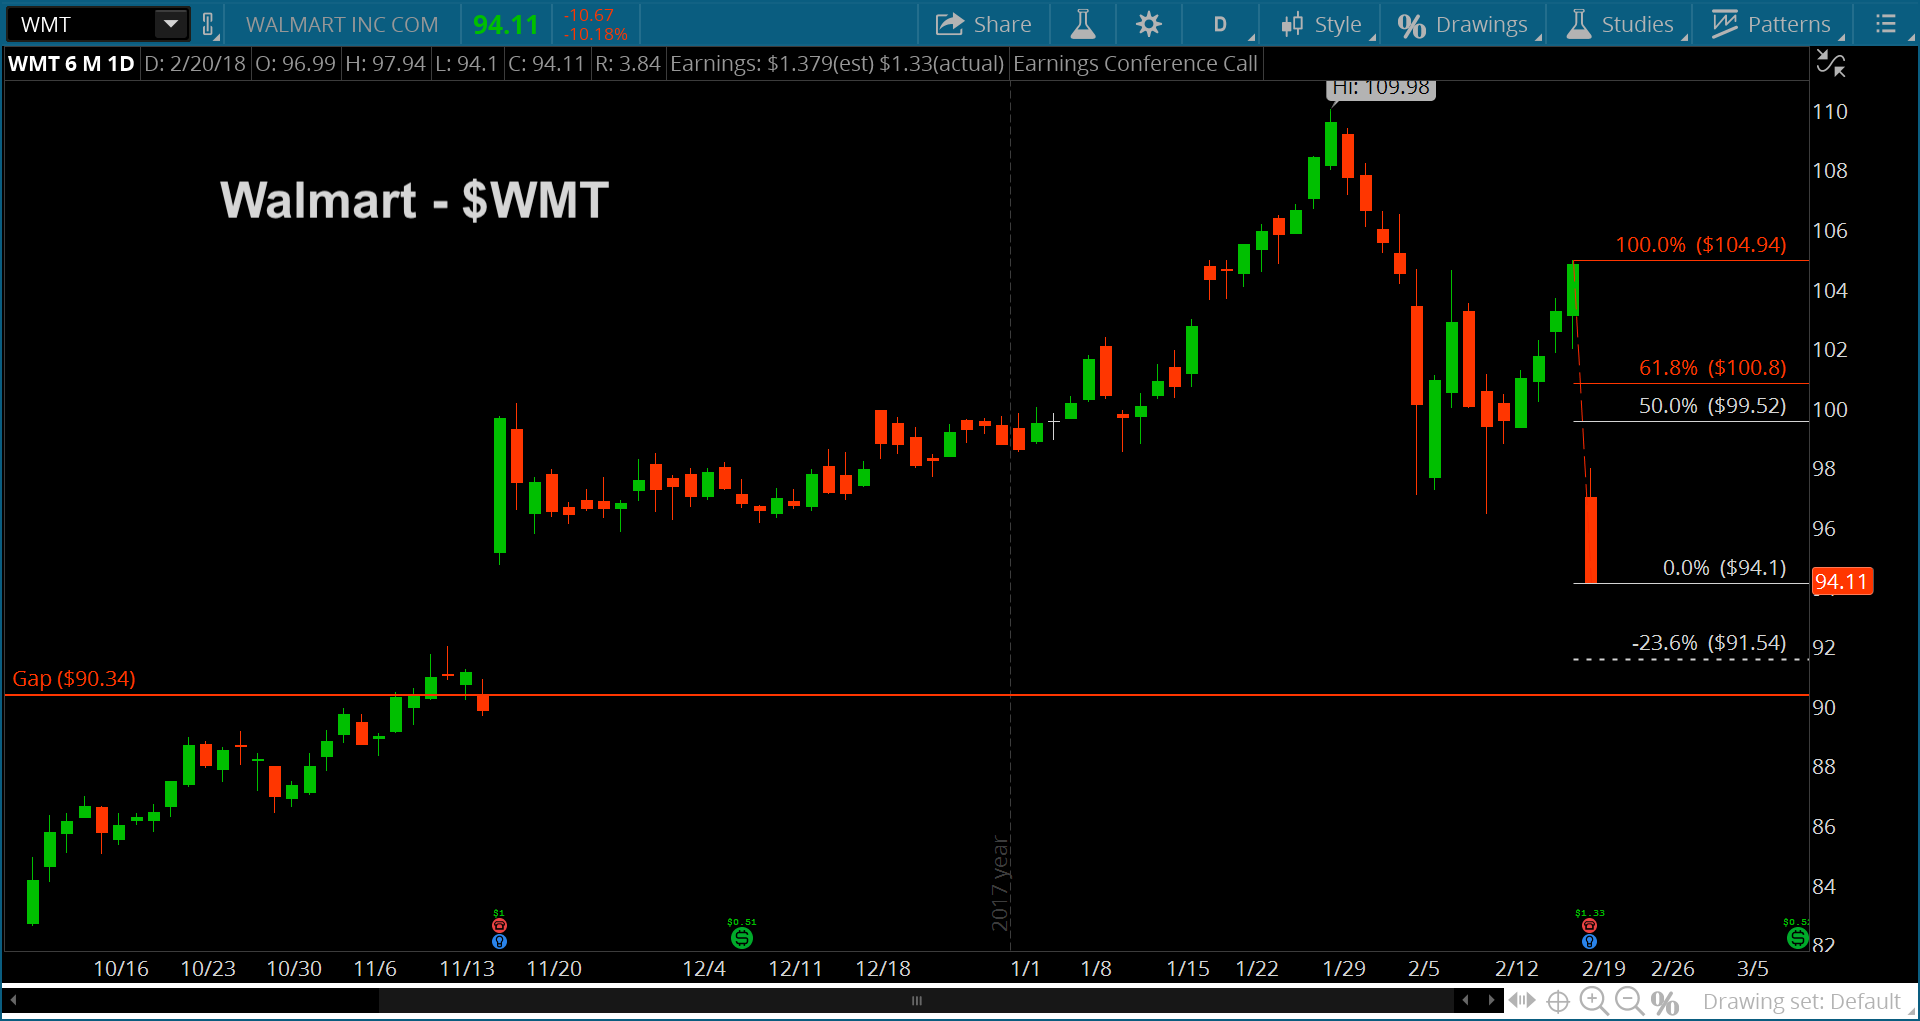
Walmart Stock (WMT) Declines Toward $90 Price Target
Walmart's online sales growth appears to be slipping and that has been a catalyst in sending the stock price lower.
But as I often say,...
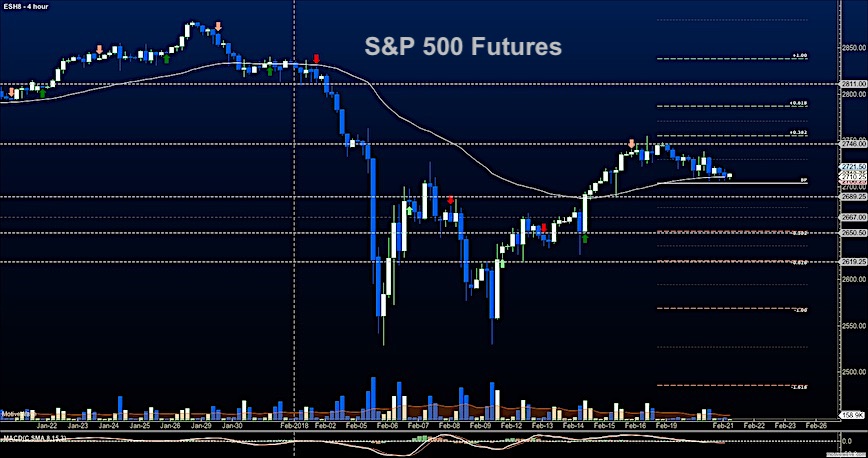
S&P 500 Futures Trading Update: Choppy Action
Stock Market Outlook for February 21, 2018
Hallmarks of mixed momentum are showing up in sideways price action that as traders deal with crosscurrents and divergent...
Market Update: Secular Shift From Deflation To Inflation Is Underway
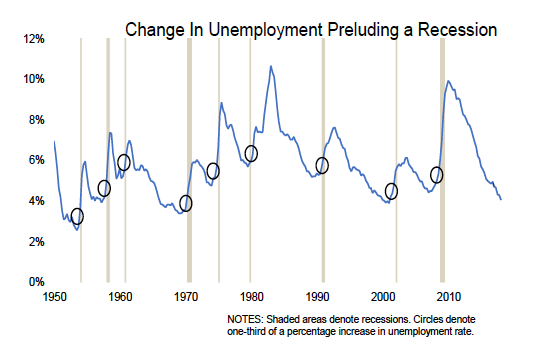
The U.S. Federal Reserve has a dual mandate of targeting 2% inflation and maximum employment. They are doing a great job of achieving their...
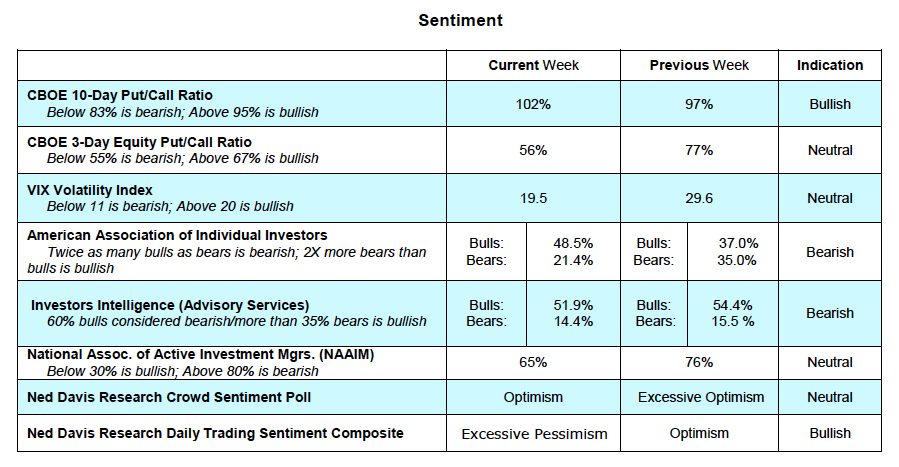
U.S. Equity Market Update: Bulls Get Back On Track
The US equity markets snapped back from a deeply oversold condition last week as the major averages posted their best weekly performance since 2013.
At...
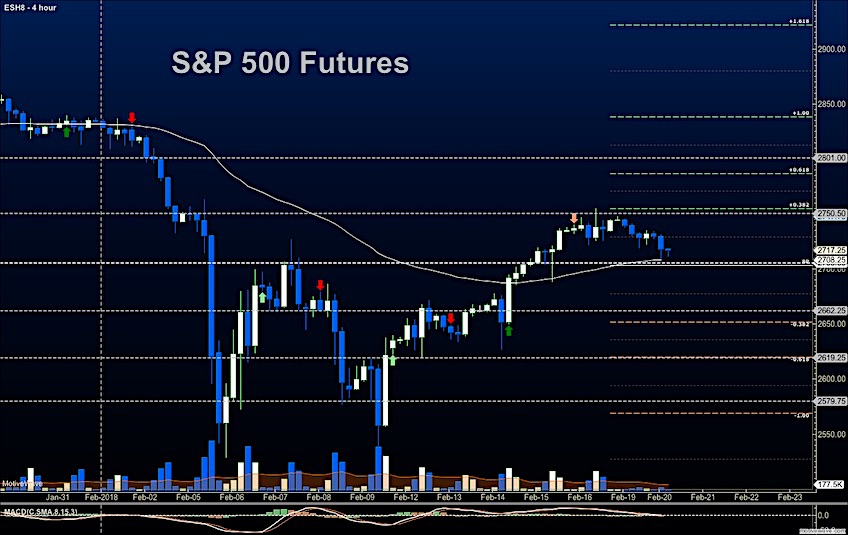
Stock Market Futures Trading Update For February 20
Broad Stock Market Outlook for February 20, 2018
The S&P 500 tested price resistance on Friday but could not overcome a key level. Now support levels...
Natural Gas Hits Lowest Level Since 2016 as Mild Weather Persists
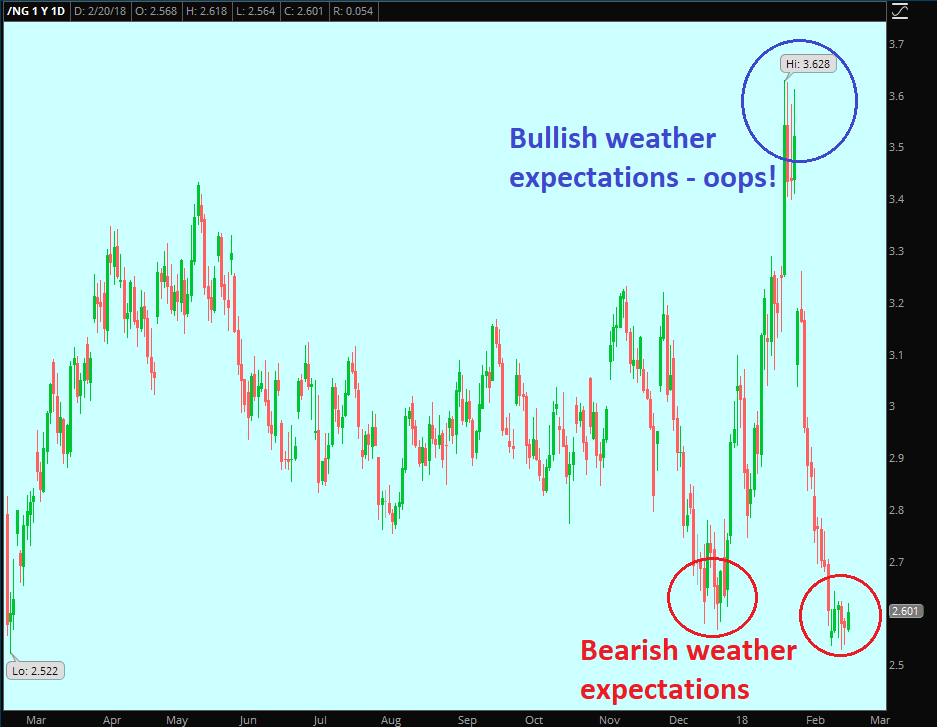
The March 2018 NYMEX natural gas contract fell $0.022 to close at $2.558/MMBtu on Friday last week.
The March contract for Natural Gas ended the...
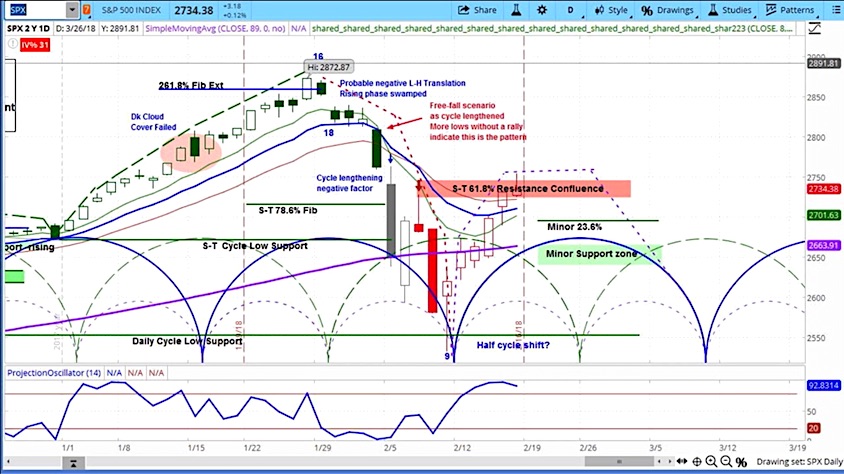
S&P 500 Trading Outlook: From Bounce To Bumpy
The stock market roared back last week, with the S&P 500 (SPX) rising over 4%.
But the rally may be in line for some "back...
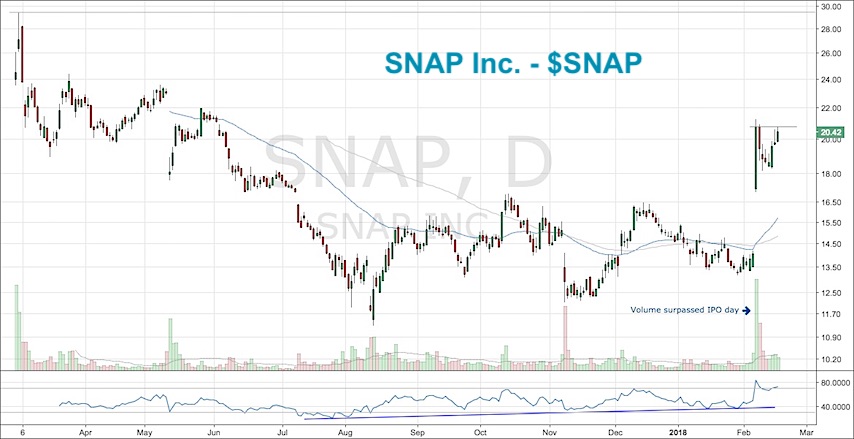
Did SNAP Finally Snap Out Of It?
I never thought I would be interested in buying SNAP Inc. (SNAP), the maker of Snapchat. But here we are.
As an active investor, I...

