Back in November, I shared a long-term historical chart of the Dow Jones Industrial Average and pointed out a megaphone pattern breakout that looked bullish for stocks.
After that post, the Dow Industrials rose over 3000 points into January before embarking on a long overdue correction.
So what now? Let’s take a look at an updated chart (see below)…
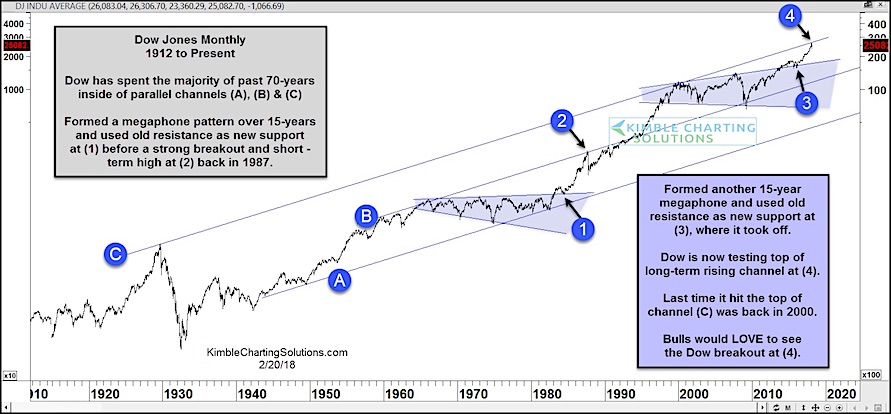
The Dow has spent the majority of the past 70 years inside parallel channels (points A, B, and C). And as you can see below, the Dow’s latest breakout above a megaphone pattern (point 3) has lead to a test of the upper channel (point 4). This is acting as resistance right now.
Look familiar? It should. This same pattern took shape during the last megaphone breakout (point 1). That breakout lead to a test of the overhead parallel channel (point 2) in 1987. That channel acted as (rising) price resistance until 1995, when it broke out once more and went on to test the upper channel boundary.
If this is any indication, its understandable why stocks are stumbling a bit here (at first pass). BUT, if they follow the same pattern, they may continue to test this rising channel resistance… and clearly bulls would LOVE to see the Dow breakout above point 4! Stay tuned.
Dow Jones Industrial Average Long-Term Chart
Note that KimbleCharting is offering a 30 day Free trial to See It Market readers. Just send me an email to services@kimblechartingsolutions.com for details to get set up.
Twitter: @KimbleCharting
Any opinions expressed herein are solely those of the author, and do not in any way represent the views or opinions of any other person or entity.

 Testing Important Price Support")
: Cup (and Maybe Handle) Watch")

