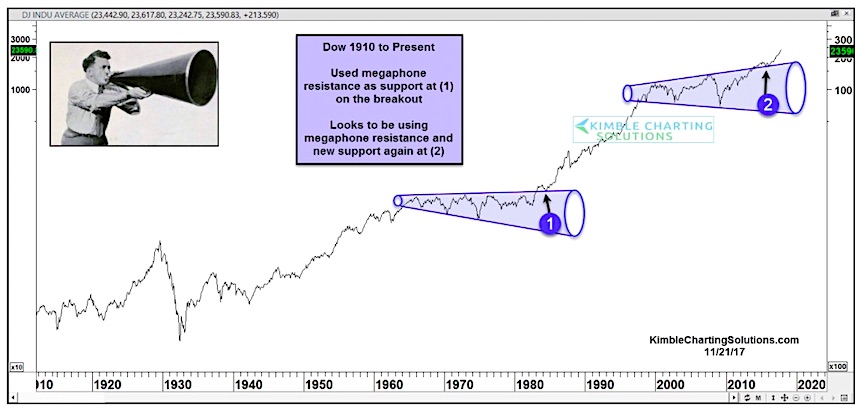
The past 100 years has brought several varieties of bull and bear markets, good times and bad times. These are found in the price movements of the Dow Jones Industrial Average (INDEXDJX:.DJI).
Today, I want to focus on one type of unique pattern that has presented itself twice in the past 100 years for the Dow Jones Industrials: The Megaphone Chart Pattern.
And in this case it’s been bullish both times.
Why is this relevant now… well the latest helped to confirm the current bull market… producing a bullish breakout and retest pattern (point 2).
Note that a similar megaphone pattern produced a similar result back in the 1980’s. How far this will run is difficult to determine… but it does highlight the bull market we are in.
Price support reside at the top of the megaphone (which also represents the 2016 lows). Long-term bulls want that level to hold.
Dow Jones Industrial Average – 100+ Year Chart
Thanks for reading and have a great weekend!
Twitter: @KimbleCharting
Any opinions expressed herein are solely those of the author, and do not in any way represent the views or opinions of any other person or entity.


