Stock Market Outlook for February 21, 2018
Hallmarks of mixed momentum are showing up in sideways price action that as traders deal with crosscurrents and divergent ideas about direction.
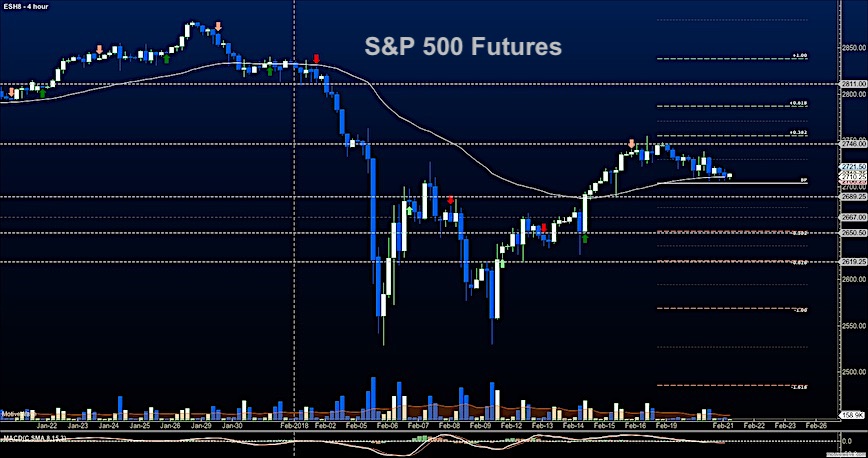
Price resistance on the S&P 500 was challenged but not overcome. The same holds true for key support. Big spikes in either direction will likely be reversed as traders remain uncertain. The key price region for buyers to hold will still be 2705.
S&P 500 Futures
Price resistance is now lower – as our patter loses its bullish form in the short term. Failure to break and hold above 2736 will bode poorly for the buyers. Keep your eyes open for a failure to test higher highs, or for the break of critical support near 2705 as this will signal slowing from the buyers and strengthening from the sellers. The bullets below represent the likely shift of trading momentum at the positive or failed retests at the levels noted.
- Buying pressure intraday will likely strengthen with a positive retest of 2735.5
- Selling pressure intraday will likely strengthen with a failed retest of 2705
- Resistance sits near 2729 to 2734.5, with 2742.75 and 2756.5 above that.
- Support sits between 2706.5 and 2700.25, with 2786.25 and 2671.5 below that.
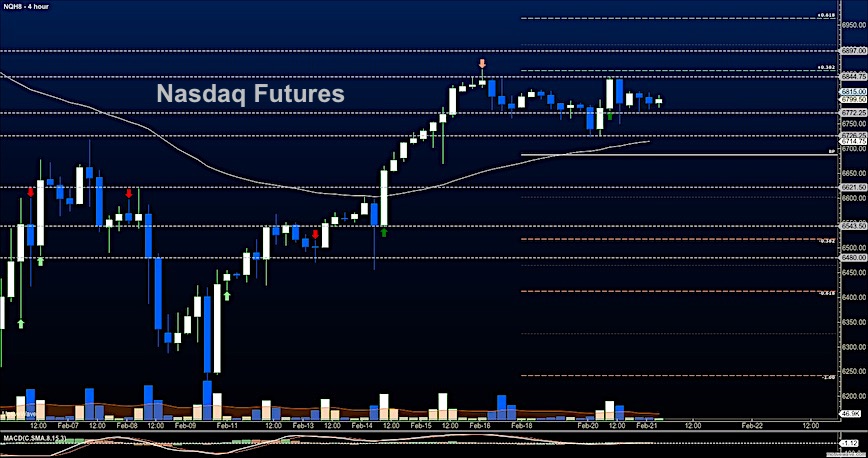
NASDAQ Futures
Momentum remains mixed. Buying pressure sits higher as prices squeeze into a tighter range and sellers hold the lid at 6842. The bullish trend remains intact in general. The bullets below represent the likely shift of intraday trading momentum at the positive or failed tests at the levels noted.
- Buying pressure intraday will likely strengthen with a positive retest of 6849.5
- Selling pressure intraday will likely strengthen with a failed retest of 6709
- Resistance sits near 6834 to 6845.25 with 6880.5 and 6898.5 above that.
- Support sits between 6772.5 and 6745.5, with 6718.5 and 6668.5 below that.
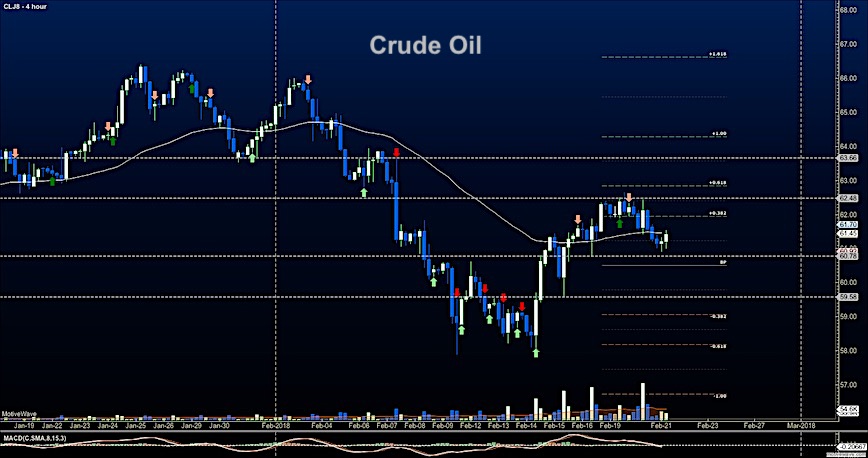
WTI Crude Oil
Mixed momentum sits here in WTI as well. Support is familiar – 60.7 – as is resistance at 62.2. The API report is released after the close today, and the EIA will be tomorrow. The bullets below represent the likely shift of intraday trading momentum at the positive or failed tests at the levels noted.
- Buying pressure intraday will likely strengthen with a positive retest of 62.45
- Selling pressure intraday will strengthen with a failed retest of 60.7
- Resistance sits near 61.74 to 62.04, with 62.32 and 62.68 above that.
- Support holds near 61.02 to 60.74, with 60.17 and 59.64 below that.
Twitter: @AnneMarieTrades
The author trades stock market futures every day and may have a position in mentioned securities at the time of publication. Any opinions expressed herein are solely those of the author, and do not in any way represent the views or opinions of any other person or entity.


