The March 2018 NYMEX natural gas contract fell $0.022 to close at $2.558/MMBtu on Friday last week.
The March contract for Natural Gas ended the week near its lows, and very near the lowest levels since February of last year. Friday’s close also marked the lowest weekly closing price on the prompt-month contract since May of 2016.
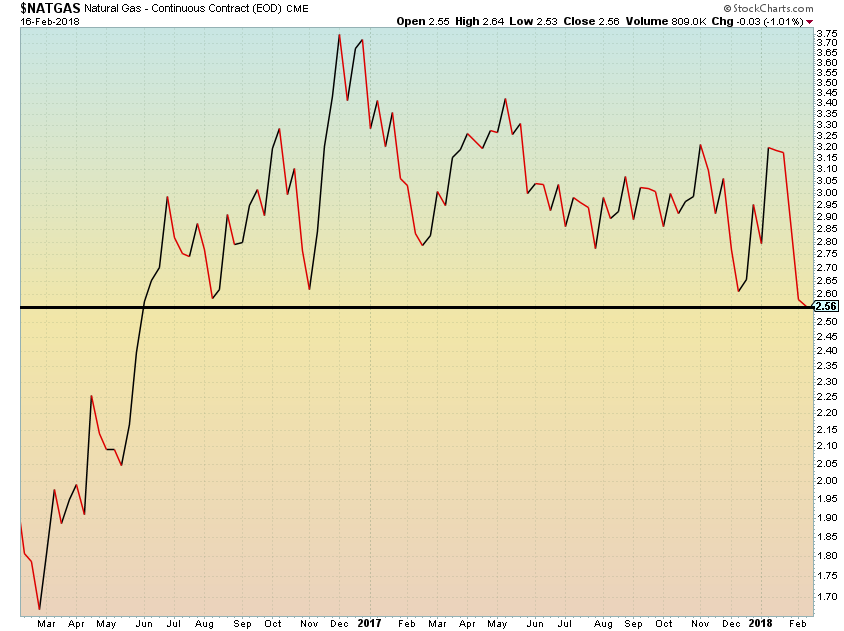
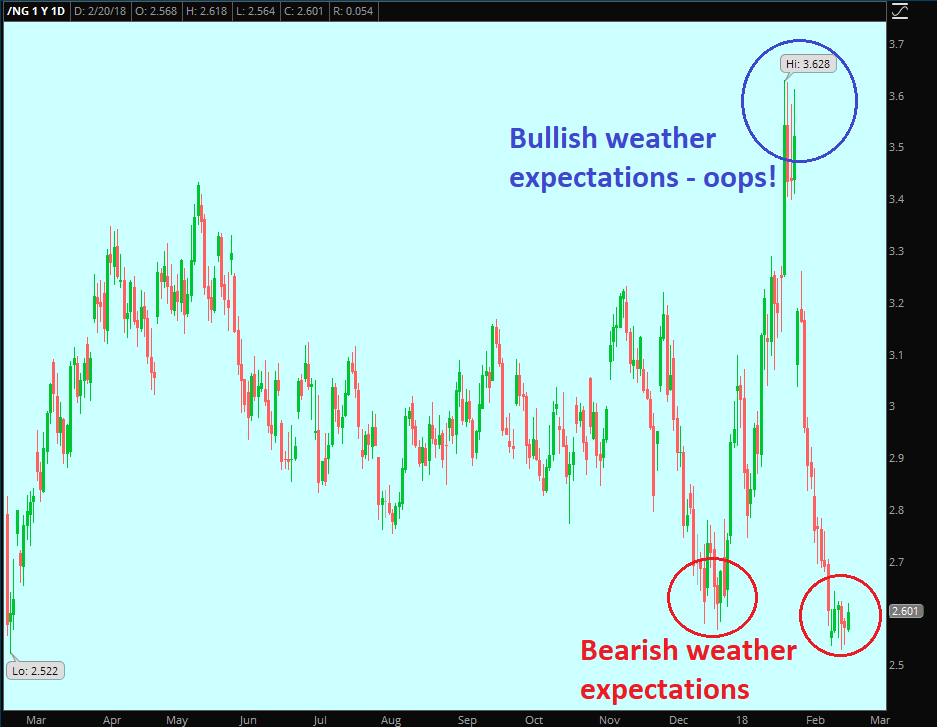
The last two months have been exceptionally volatile for natural gas.
A 13-month high was set in early February based on bullish weather expectations for this month. As it turned out, February will be an exceptionally weak demand period as mother nature made a fool of the weather models and some forecasters and demand analysts.
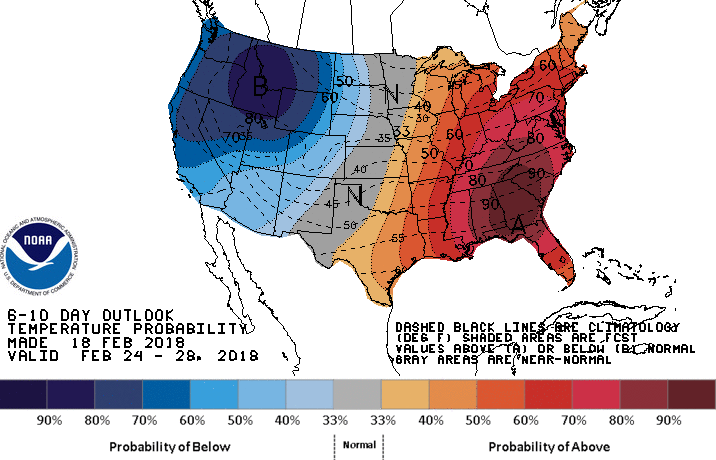
Looking deeper into last week, a stronger than expected EIA natural gas storage draw announced on Thursday for the prior week did little to excite the bulls and weather models continue to suggest generally bearish near-term mild conditions for the major demand centers. The NOAA CPC 6-10 day temperature probability outlook is shown below.
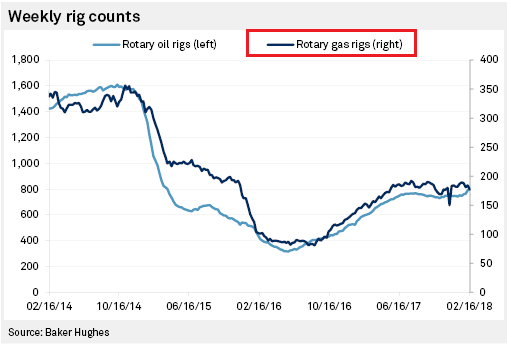
Friday’s Baker Hughes rig count data release had little no apparent impact to the market – natural gas-directed rigs were down 7 on the week to 177, up 24 year-to-date. Chart via S&P Market Intelligence/SNL Energy.
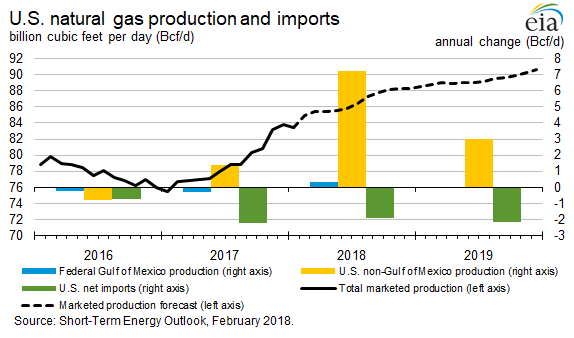
Sticking to the production theme, the EIA expects March to mark 12 consecutive months of shale gas growth, with gas output reaching 19% above March of 2017 levels (a new record). Natural gas production is expected to hit record levels throughout the balance of the year as shown in the chart below from the EIA.
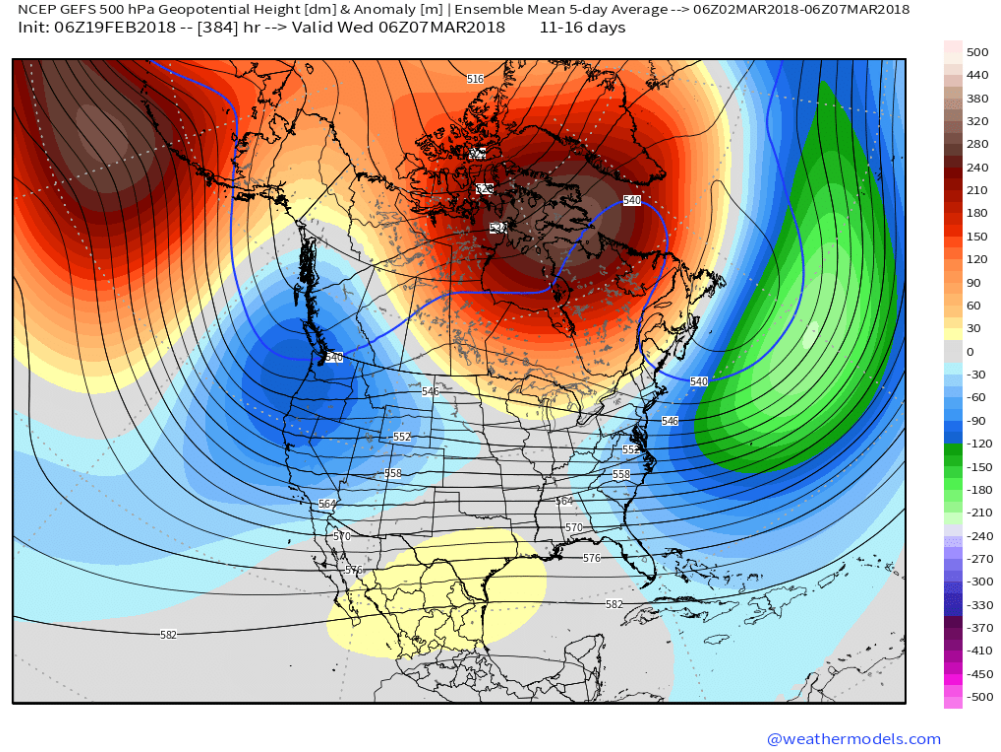
President’s Day is a NYMEX trading holiday, but futures are higher today from Friday’s close. On the weather front, the American GFS Ensembles model (looking out 11-16 days) indicate the potential for a bullish “negative NAO” pattern which is a high pressure area near Greenland that typically promotes a colder pattern over the eastern US. The Euro model is not quite on board as of yet, so this pattern is by no means set in stone.
Thanks for reading. Follow me on twitter @MikeZaccardi
Any opinions expressed herein are solely those of the author, and do not in any way represent the views or opinions of any other person or entity.

: Showing Some Signs of Emerging Strength")
