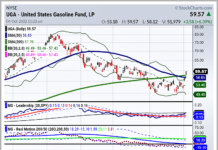
Why Gasoline Prices Matter to the Stock Market
It's no secret that gas prices significantly impact the economy, discretionary spending, and stock market prices.
Gas prices were at record highs following an incredible...
Did the 10-Year Bond Yield Peak at Key Fibonacci Level?
During the 3rd quarter of this year, we saw the 10-year treasury bond yield reach its highest level in nearly 15 years!
This corresponded with...
Did Semiconductor Stocks Bottom? 3 Technical Lessons
We currently have high inflation, a rising US dollar, and massive global interest rate hikes have hammered stocks. Investors have lost approximately $24 trillion...
Financial Sector (XLF) Trading At Must-Hold Price Support
The month of September ended with a thud as the S&P 500 Index closed at new lows.
And several sectors are now trading at critical...
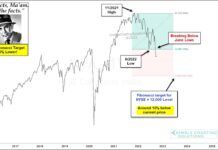
NYSE Composite Highlights Painful Bear Market For Investors!
Earlier this week, we highlighted how the NYSE Composite was breaking to new lows. Well, this week we are seeing follow-through selling.
This is a...
Stock Market Nearing A Bounce, But Bear Not Over
There is potential for a pause or a short-term pop for several stock market indices that are near the MOB target bands, including the...
Chinese Stock Market Breaks Major Price Support!
Chinese stocks have lagged the broader global market for quite some time. And this is now showing up in a bear market that...
September Market Insights, Stock Calls, and a Look Ahead
As we move into October soon, I wanted to take a moment to highlight some of my recent daily columns from September.
On September 13,...
Will Junk Bonds Pull Stock Market Lower Yet?
When stocks are showing weakness, we can learn a lot by watching the credit markets.
And in today's case, Junk Bonds and the ETF $JNK.
Better...
Why Retail Stocks are a key Market and Economic Indicator
As the selloff continues, our Big View service Risk Gauge has been bearish for weeks, signaling risk off.
Most of our portfolio strategies hold more than 50%...


