During the 3rd quarter of this year, we saw the 10-year treasury bond yield reach its highest level in nearly 15 years!
This corresponded with mortgage rates reaching levels we hadn’t seen in some time. And all this is occurring while the Federal Reserve raises interest rates to cool record inflation.
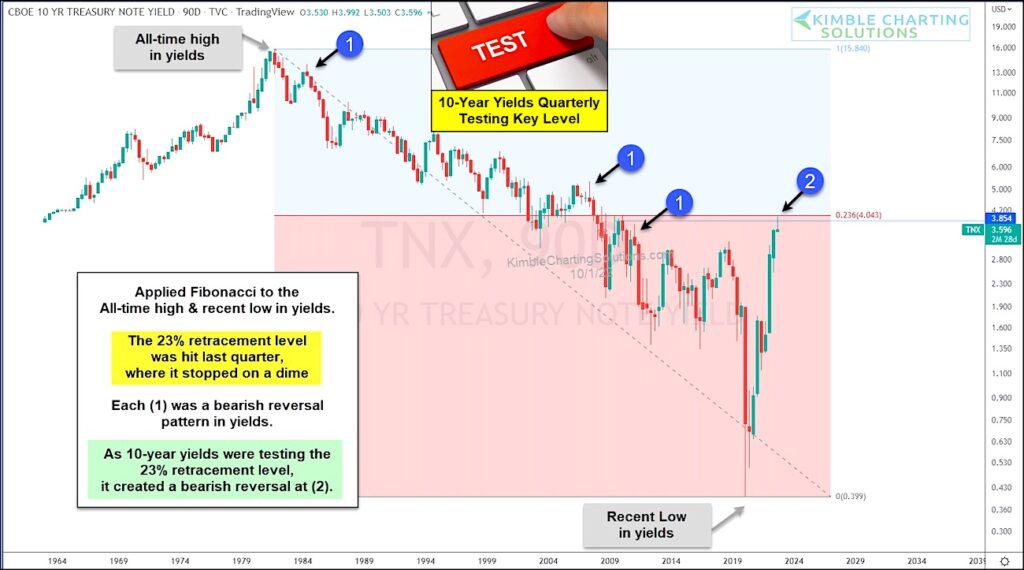
So is there any good news here? Well, today’s “quarterly” chart of the 10-year treasury bond yield highlights the long-term downtrend that interest rates had been in. It also shows just how extreme the rally over the past 2 years has been!
When we look closer at the chart, we can see a few bearish reversals that left long wicks at each (1). This is important because last quarter we saw another long-wicked bearish reversal at (2). All of the prior reversals lead to big drops in the interest rate. Could happen here too.
As well, when we apply Fibonacci to the all-time high and low in interest rates we can see that the 10-year yield tested the first common fib retracement level this past quarter – 23.6%. And it stopped on a dime and reversed lower.
This is an important area to watch. If this reversal holds, consumers may see lower interest rates in the future. Stay tuned!
$TNX 10-Year Treasury Bond Yields “Quarterly” Chart
Note that KimbleCharting is offering a 2 week Free trial to See It Market readers. Just send me an email to services@kimblechartingsolutions.com for details to get set up.
Twitter: @KimbleCharting
Any opinions expressed herein are solely those of the author, and do not in any way represent the views or opinions of any other person or entity.

: Worrisome to Broader Market?")
