We currently have high inflation, a rising US dollar, and massive global interest rate hikes have hammered stocks. Investors have lost approximately $24 trillion in value destruction for 2022 already.
The good news today is it appears a short-term bottom has been reached, and a potential rally is beginning. The month and quarter began with nearly an 800-point rally in the Dow.
We are focusing on semiconductors today, as a member of the modern family.
Plus, semiconductors can be viewed as great indicators in a bear or bull market rally.
That said, the semis (SMH) ETF has three interesting technical features that are a reliable way to assess what to do from here and how to know if this rally will last.
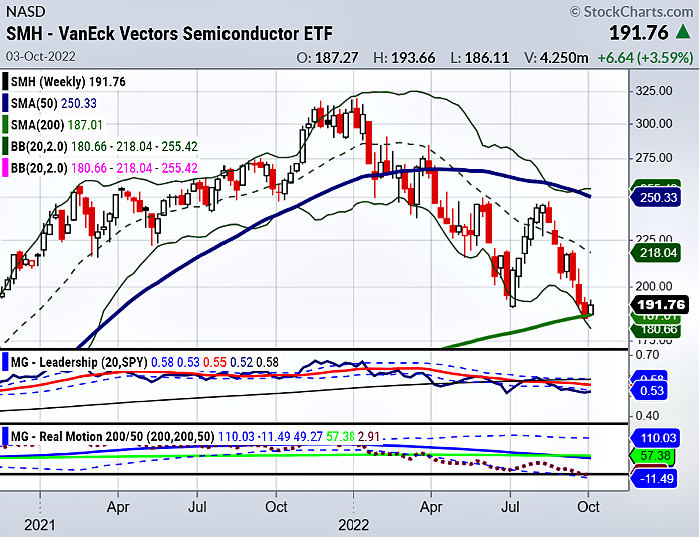
The SMH ETF has three interesting technical features that are a reliable way to assess what to do from here.
- On Friday, the candlestick showed an inverted hammer Doji- a sign of a potential reversal of a trend.
- Today’s low volume and follow-through took SMH back to resistance. This is a good start; over 195 to regain technical strength would be better, with 210 a reasonable target.
- In Mish’s book, she talks about the confirmation of a phase change. With the price of SMH back above the 200 (week moving average) WMA, the close below last week did not confirm a distribution phase as we need 2 weeks to close below to confirm.
Therefore, we need this week to close above the 200-WMA (and then a confirmation next week to return to a caution phase).
Essentially, with some patience, no FOMO is necessary if the rally is good.
There’s good reason to believe that stocks will continue to face volatility as interest rates increase in the months ahead. At MarketGauge, we use our proprietary trading indicators and trading rules to keep us on the right side of the trend.
Investors should keep an open mind about higher lows in semiconductors.
But as always, trade wisely, watch the charts, and do your research before putting any money into the stock market.
Mish’s Upcoming Seminars
ChartCon 2022 Stockcharts October 7th and 8th Seattle.
Join me and 16 other elite market experts for live trading rooms, fireside chats, and panel discussions.
October 7th 11:15 AM (ET), 8:15 AM (PT) Stock Picking Lightning Round with Mish
October 8th 2:00 PM (ET), 11:00 AM (PT) Bulls vs. Bears Debate with Keith and Mish on opposing sides of a trade!
Stock Market ETFs Trading Analysis & Summary:
S&P 500 (SPY) 358 support and 369 resistance
Russell 2000 (IWM) 167 support and 171 resistance
Dow (DIA) 292 support and 297 resistance
Nasdaq (QQQ) 268 support and 277 resistance
KRE (Regional Banks) 57.90 support and 61.68 resistance
SMH (Semiconductors) 189 support and 194 resistance
IYT (Transportation) 198 support and 203 resistance
IBB (Biotechnology) 117.38 support and 120.41 resistance
XRT (Retail) 56.55 support and resistance 58.71
Twitter: @marketminute
The author may have a position in mentioned securities at the time of publication. Any opinions expressed herein are solely those of the author and do not represent the views or opinions of any other person or entity.
")

 Testing Important Price Support")
")
