When stocks are showing weakness, we can learn a lot by watching the credit markets.
And in today’s case, Junk Bonds and the ETF $JNK.
Better yet, today we share 2 charts to better illustrate was is happening in the broader markets.
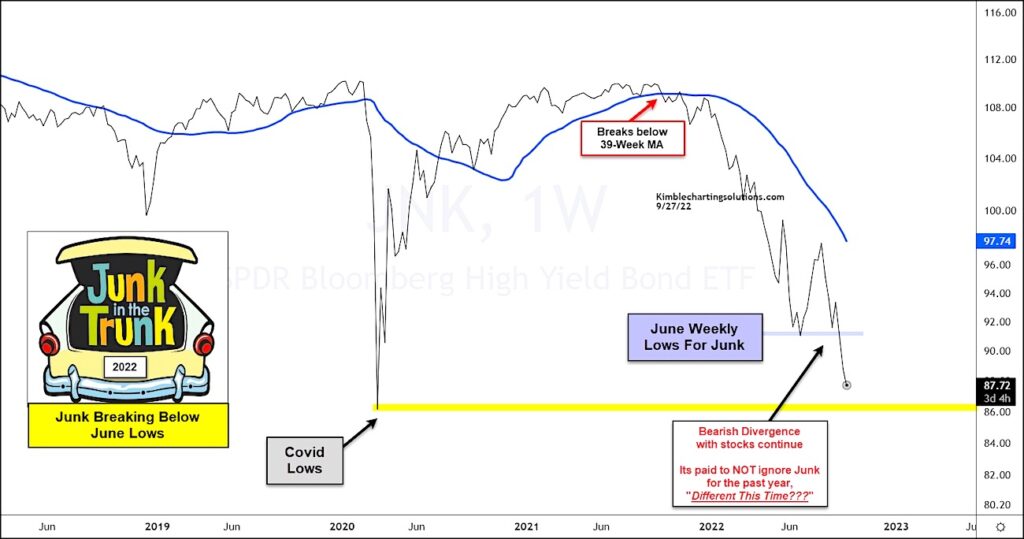
The first chart is the Junk Bonds ETF (JNK) on a “weekly” timeframe. As you can see, $JNK is nearing its COVID lows and has fallen much lower than its June low. This has formed a bearish divergence with stocks, as several indices have yet to puncture the June low… or, if they did, it was very marginal.
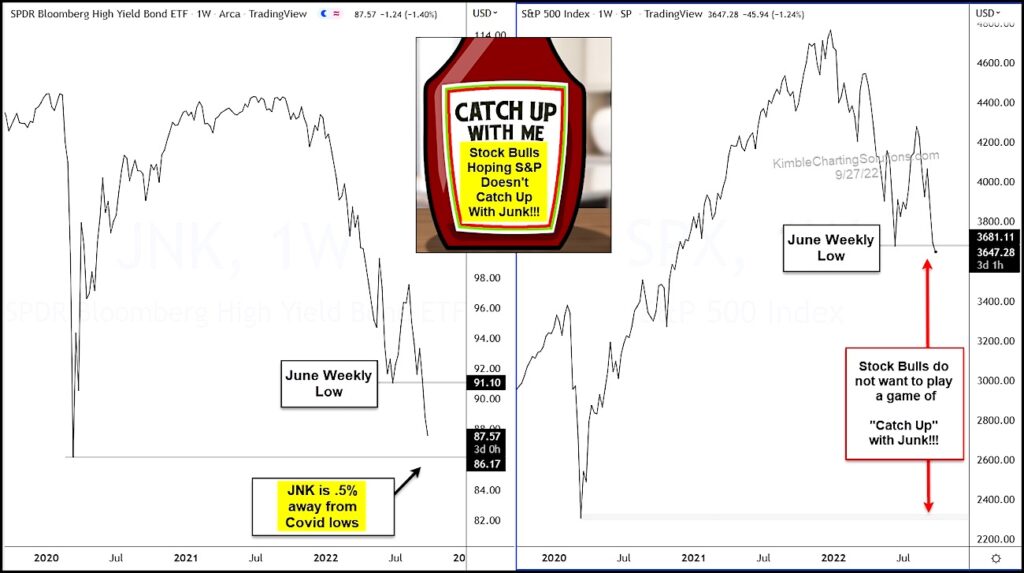
The second chart looks at $JNK versus the S&P 500 ETF $SPY. This illustrates just how much further $JNK has fallen when compared to stocks.
In summary, stock bulls do not want to play a game of catch up with junk bonds! Stay tuned!!
$JNK Junk Bonds ETF Chart
$JNK Junk Bonds ETF versus $SPY S&P 500 ETF Chart
Note that KimbleCharting is offering a 2 week Free trial to See It Market readers. Just send me an email to services@kimblechartingsolutions.com for details to get set up.
Twitter: @KimbleCharting
Any opinions expressed herein are solely those of the author, and do not in any way represent the views or opinions of any other person or entity.


