As the selloff continues, our Big View service Risk Gauge has been bearish for weeks, signaling risk off.
Most of our portfolio strategies hold more than 50% cash, some are short, and my discretionary service is looking to deploy capital soon.
Today, we’ll focus on what the retail sector, represented by the SPDR Retail ETF (AKA Granny, Modern Family member), is telling us about the economy and the market’s direction.
The Modern Family looks at industries that lead the economy (housing, retail, and transportation, to name a few).
Is XRT signaling that there is more economic trouble ahead?
It’s hardly surprising that XRT has underperformed the SPY recently since retailers face historic high inflation and consumers are under pressure.
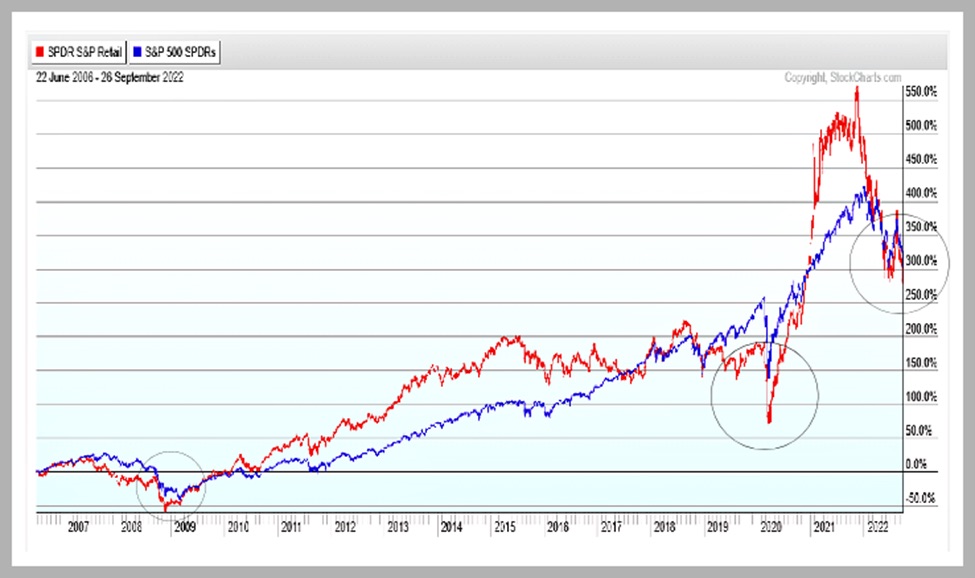
If we look at the price history of XRT, every time the sector has taken a nosedive, it’s been accompanied by a steep decline in the S&P 500.
The most recent example can be seen in March 2020 and in 2008. We are seeing similar signs now. XRT will struggle as the business cycle weakens.
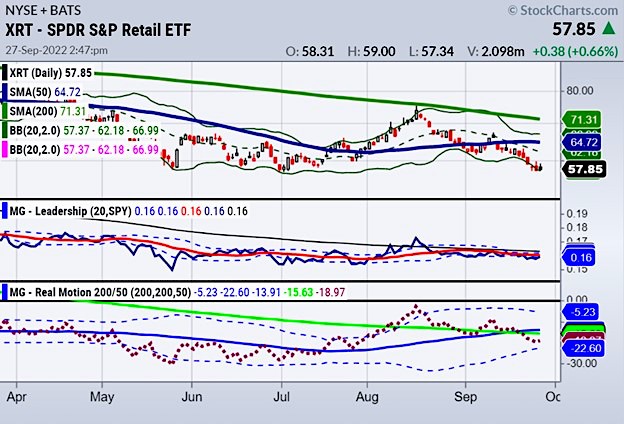
On a daily timeframe, XRT has already closed well below its respective 200-day average. It is also -36.5% year-to-date down compared to the SPY decline of -23.8%. Real Motion is showing continued downward momentum.
Granny Retail is warning us that a recession is on the horizon, and lower stock prices are possible.
A current retest of XRT’s recent lows of around $57/share might represent the beginning of a bottoming process, but Granny could fall much further if past bear markets are a guide.
Keep an eye on the retail sector and stay ahead of the curve.
Check out Mish in the Media:
Bloomberg on 09-27-22
Stock Market ETFs Trading Analysis & Summary:
S&P 500 (SPY) Testing the previous low 362 support and 370 resistance
Russell 2000 (IWM) Broke the June low of 165.18 – 162 support and resistance 170
Dow Jones Industrials (DIA) Broke June low – Support at 289 and resistance at 298
Nasdaq (QQQ) Testing the June low – Support at 269 and resistance at 280
KRE (Regional Banks) 57 support and resistance at 61
SMH (Semiconductors) 187 support and 194 resistance
IYT (Transportation) 196 support and 204 resistance
IBB (Biotechnology) 112 support and 118 resistance
XRT (Retail) Support at 55 and 60 resistance
Twitter: @marketminute
The author may have a position in mentioned securities at the time of publication. Any opinions expressed herein are solely those of the author and do not represent the views or opinions of any other person or entity.


