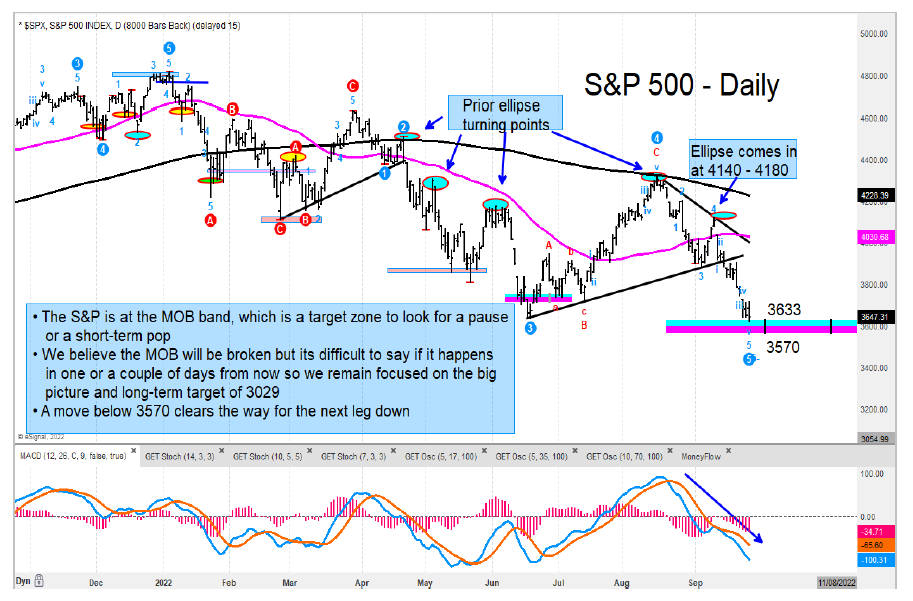
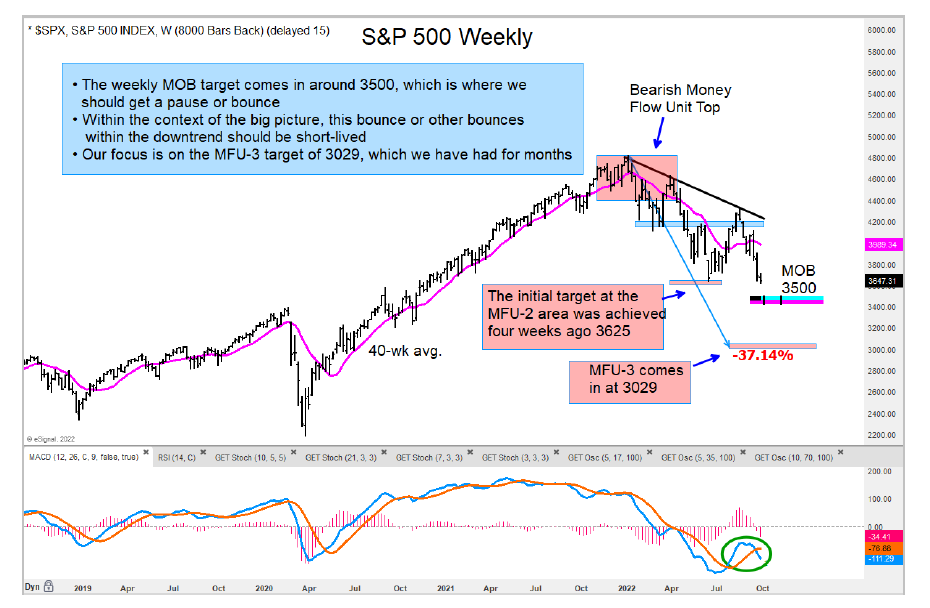
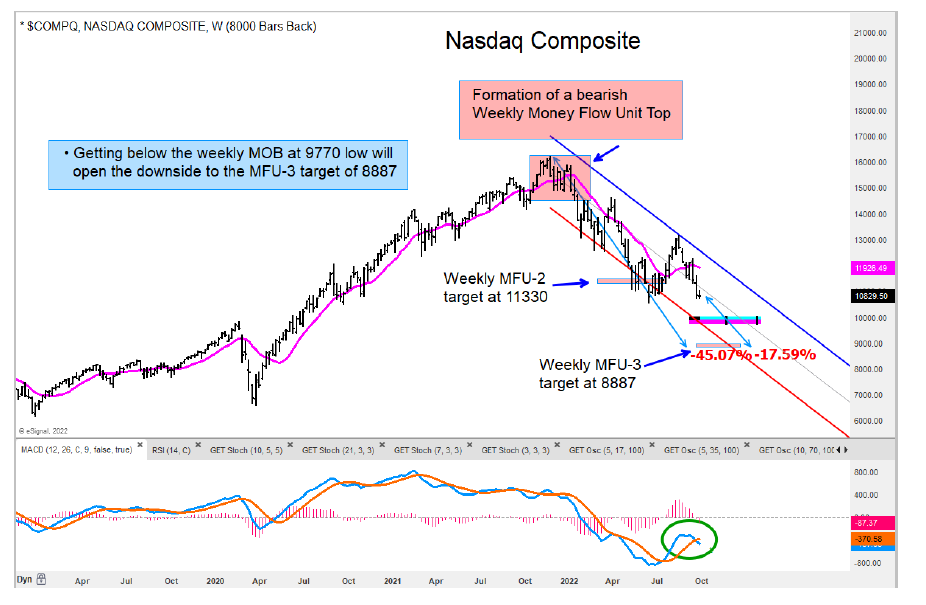
There is potential for a pause or a short-term pop for several stock market indices that are near the MOB target bands, including the S&P 500, the Nasdaq 100, Nasdaq Composite, Russell 2000, and the MSCI All Country World Index Ex. U.S.
That said, if we get a short-term pop from these zones, I don’t expect it to last long. And, furthermore, I think the June lows will eventually be broken.
In fact, some indices have already broken the June low, including the NYSE Composite Index, which has already broken the June low in a decisive way. The Dow Industrials have fallen below the June low as well.
Of all the S&P sectors only the Utilities $XLU has a positive score. The relative trend is what is the driver for that score, but the absolute trend remains weak.
Below are charts of the S&P 500 Index (daily & weekly) and the Nasdaq Composite (weekly). Looking at the S&P 500, the daily and weekly are nearing a bounce zone around 3500-3600.
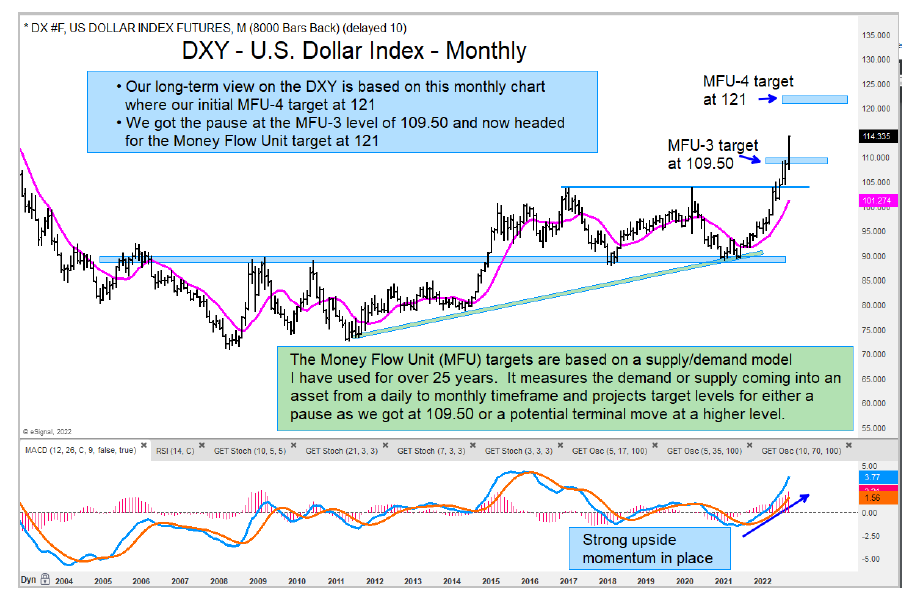
In currency land, the U.S. Dollar index is gaining momentum and looks poised to get to our MFU-4 target of 121.
And the 10 year treasury bond yield is closing in on our target of 4.29.
In commodities, we are watching Crude oil to see if a low can form in the low-to-mid $70’s.
Twitter: @GuyCerundolo
The author or his firm have a position in mentioned securities at the time of publication. Any opinions expressed herein are solely those of the author, and do not in any way represent the views or opinions of any other person or entity.


")


