Chinese stocks have lagged the broader global market for quite some time. And this is now showing up in a bear market that is going much deeper than other stock markets.
Today, we look at the Hang Seng Index on a long-term “monthly” timeframe. And it’s not a good look.
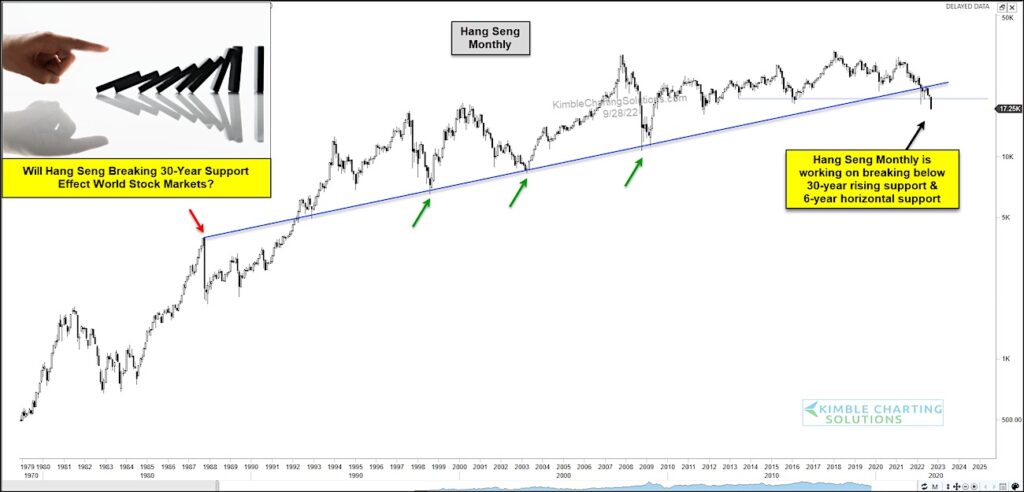
Here we can see the index breaking below two key price supports. The first price support was its multi-decade trend line while the second support was a 6-year horizontal support that aligned with the 2020 crash lows.
This is a long-term chart with “monthly” bars so this may take some time to play out. BUT one has to be concerned with how this will effect world stock markets (and to be clear, it already is!).
There is a lot of room to fall before finding price support, so be cautious out there. And stay tuned!
Hang Seng Index “monthly” Chart
Note that KimbleCharting is offering a 2 week Free trial to See It Market readers. Just send me an email to services@kimblechartingsolutions.com for details to get set up.
Twitter: @KimbleCharting
Any opinions expressed herein are solely those of the author, and do not in any way represent the views or opinions of any other person or entity.
")


")
