The S&P 500 and Nasdaq 100 have seen strong gains off their mid-April lows.
But is this recent uptrend sustainable, pushing these stock market indexes to new all-time highs?
Today we will reveal three market breadth indicators that we are following to confirm a bullish market trend, and what we would need to see to reverse and signal a new bearish phase for stocks.
By evaluating signals from multiple breadth indicators, we can better understand the nature of a stock market rally, and recognize when a “change of character” occurs based on shifts in those signals. Insights on these indicators should shape our view on whether the S&P 500 will continue its ascent and achieve new all-time highs this month. I’m interested to hear your thoughts and predictions!
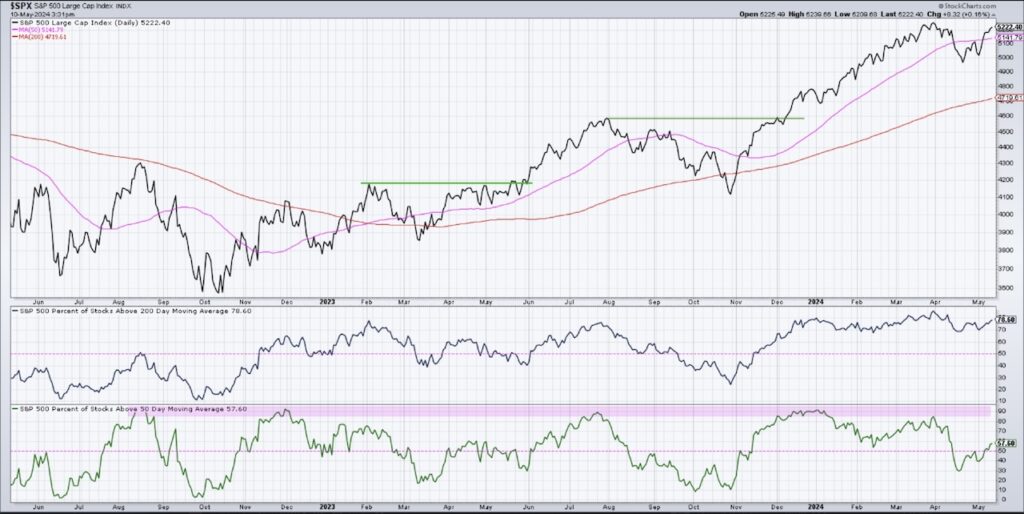
Is the percentage of stocks above their key moving averages a reliable indicator of market health?
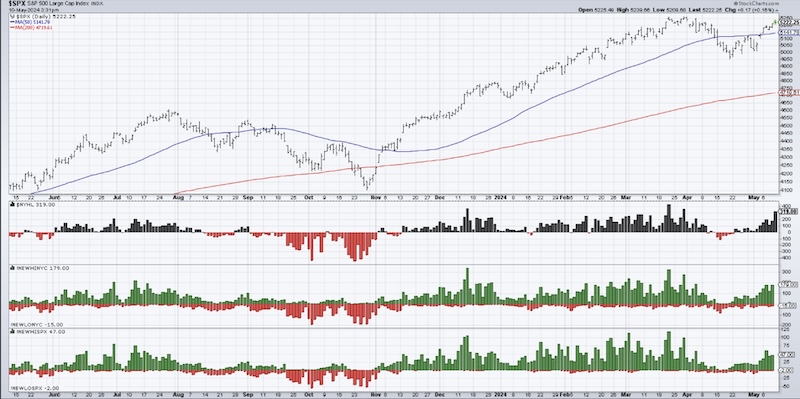
Can the difference between new highs and new lows on major indexes guide our understanding of market behavior?
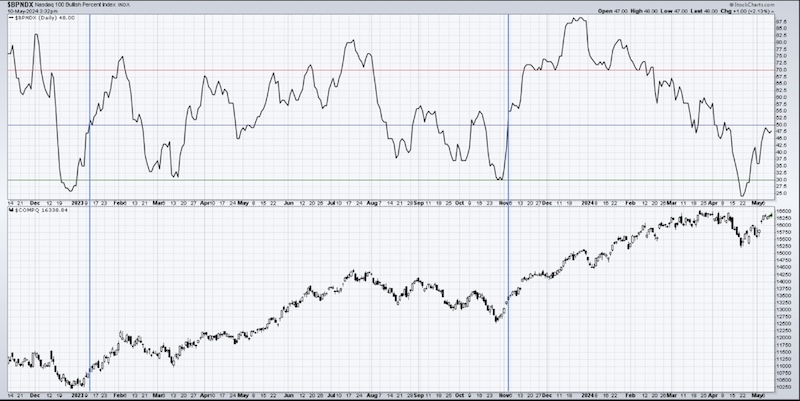
Does the Bullish Percent Index on the Nasdaq 100 confirm the vitality of mega cap tech stocks in sustaining market rallies?
(Video) 3 Market Breadth Indicators For Bulls To Watch!
Market Breadth Charts
Twitter: @DKellerCMT
The author may have positions in mentioned securities at the time of publication. Any opinions expressed herein are solely those of the author, and do not in any way represent the views or opinions of any other person or entity.


