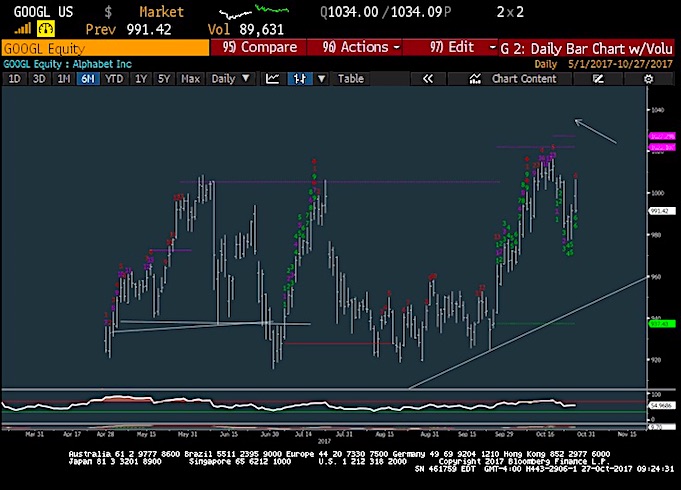
Tech Earnings Chart Review: AMZN, GOOGL, MSFT, FSLR, BIDU
Large cap tech stocks and the tech sector as a whole are receiving a boost from big earnings reports last night and the morning.
Earnings...
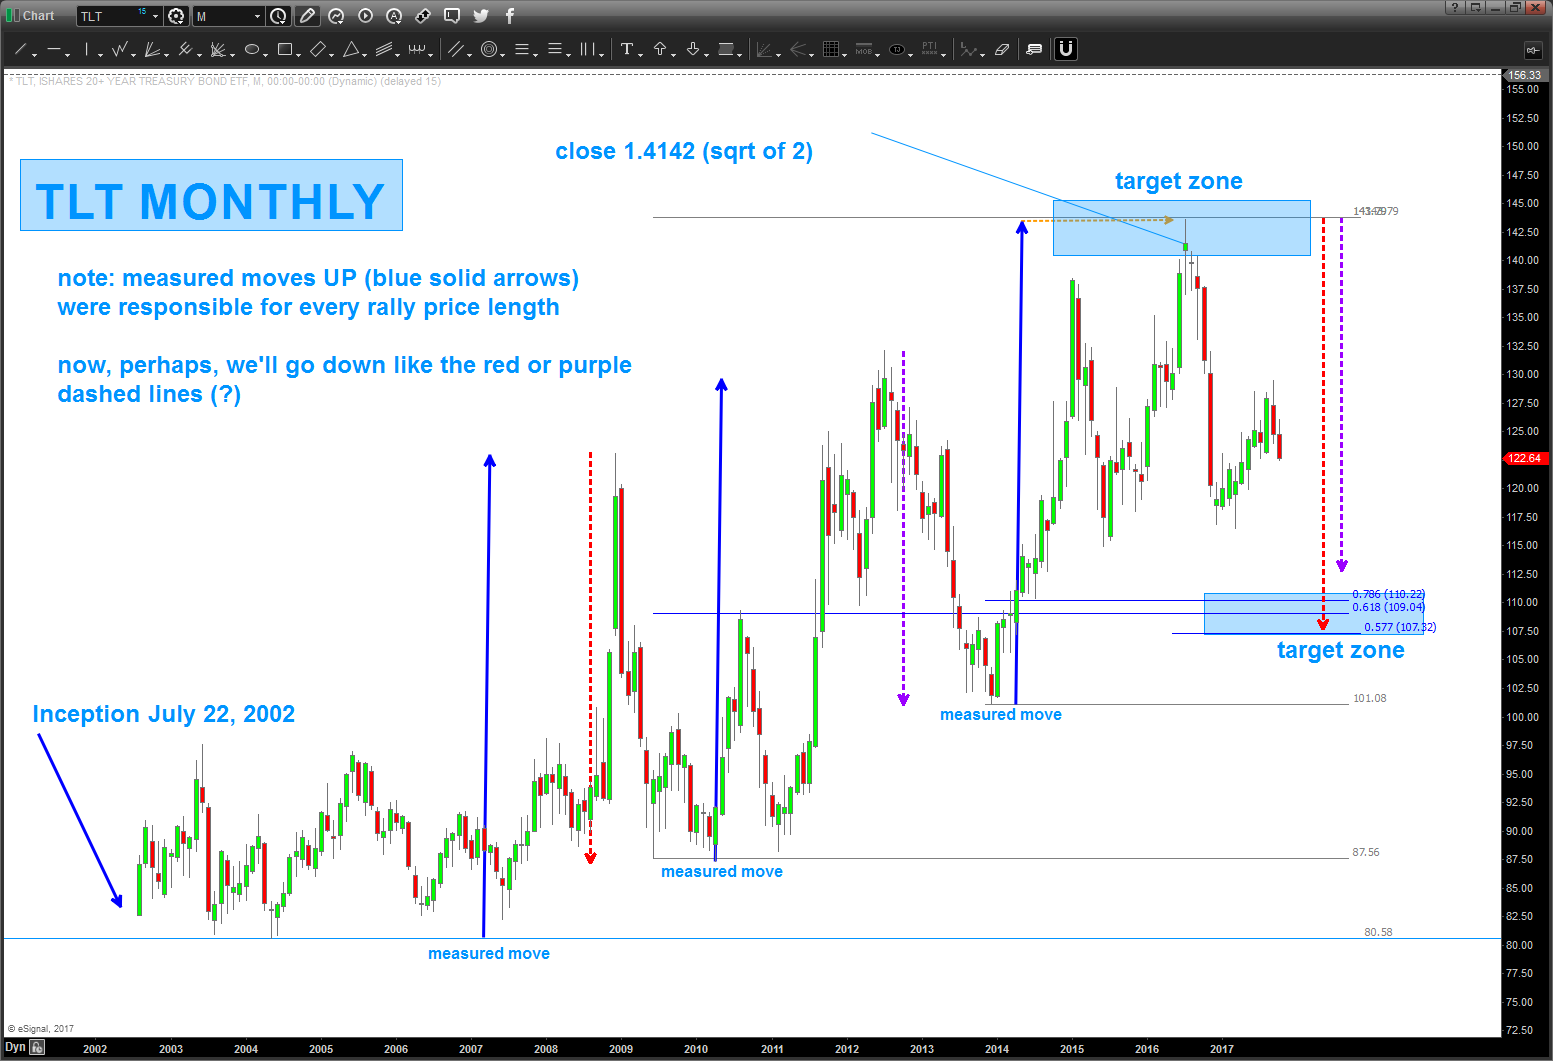
Is The Popular Treasury Bonds ETF (TLT) Headed Lower Yet?
In July of 2016 I discussed how the chart patterns were suggesting the popular 20 Year+ Treasury Bond ETF (NASDAQ:TLT) was about to hit...
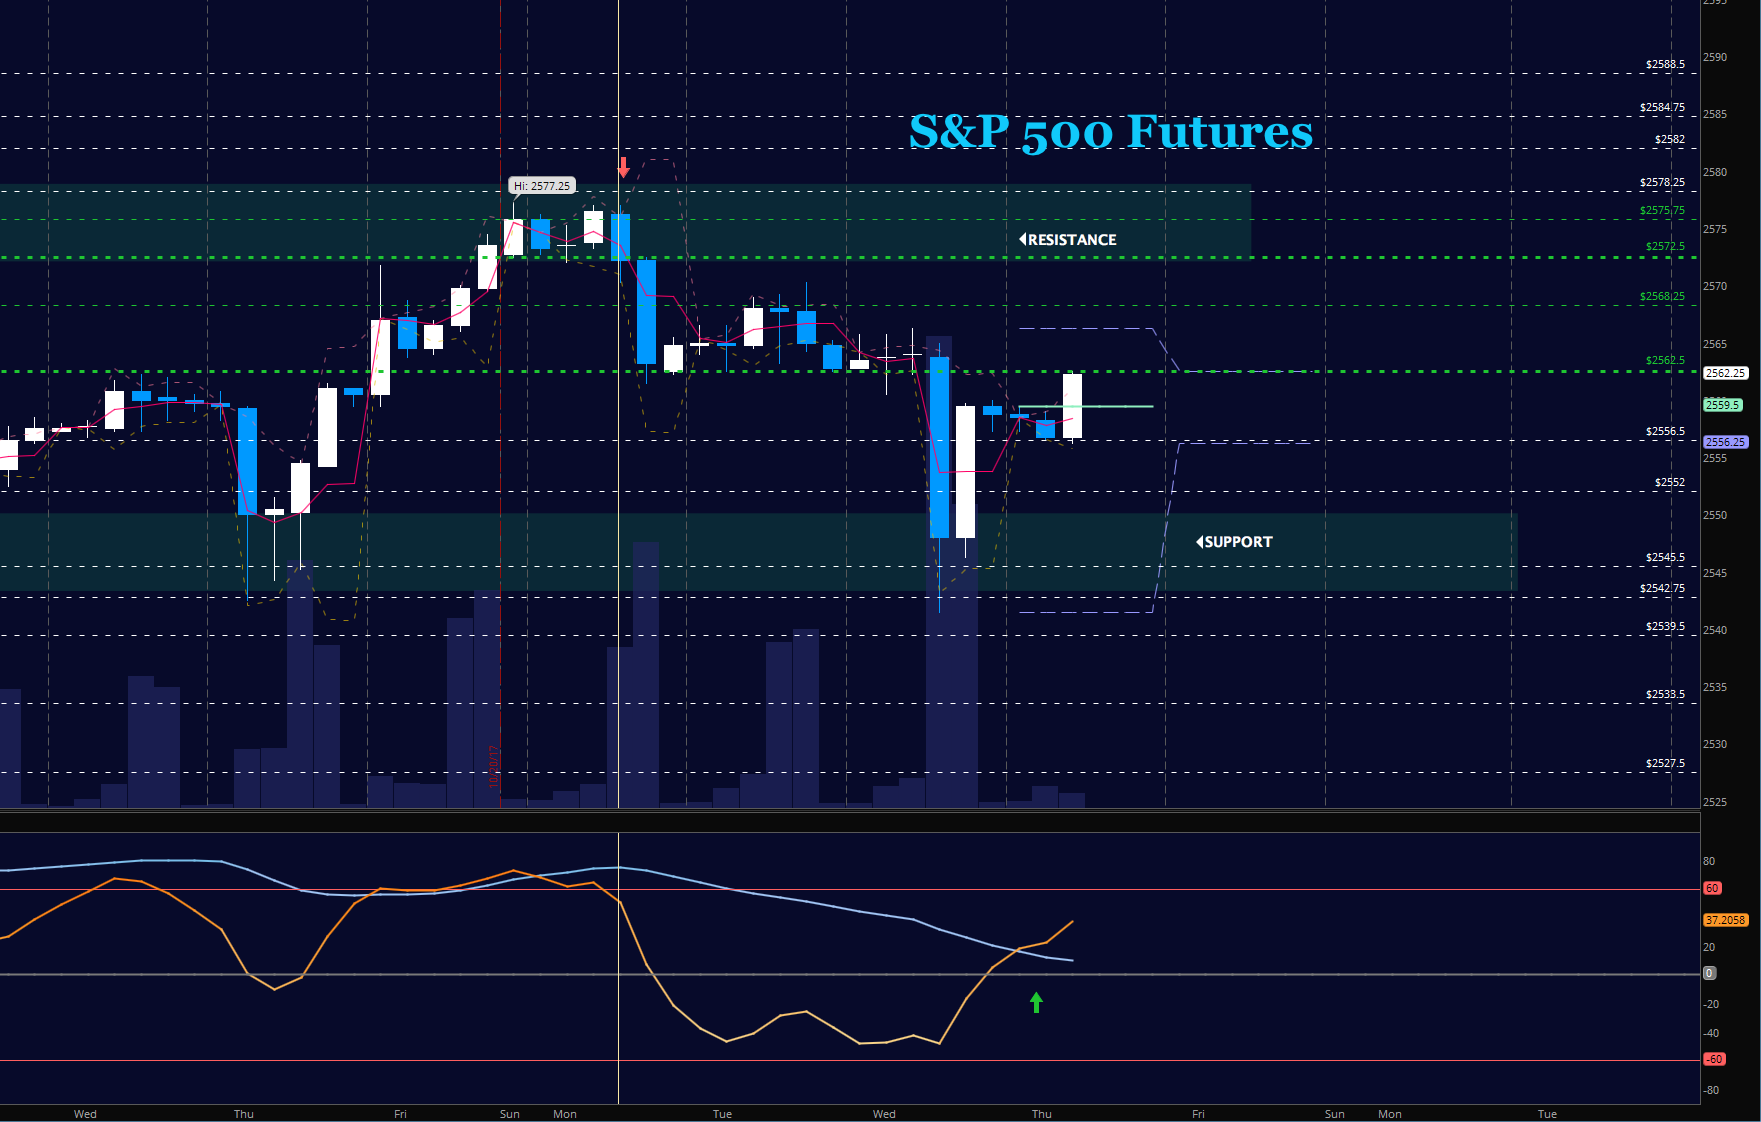
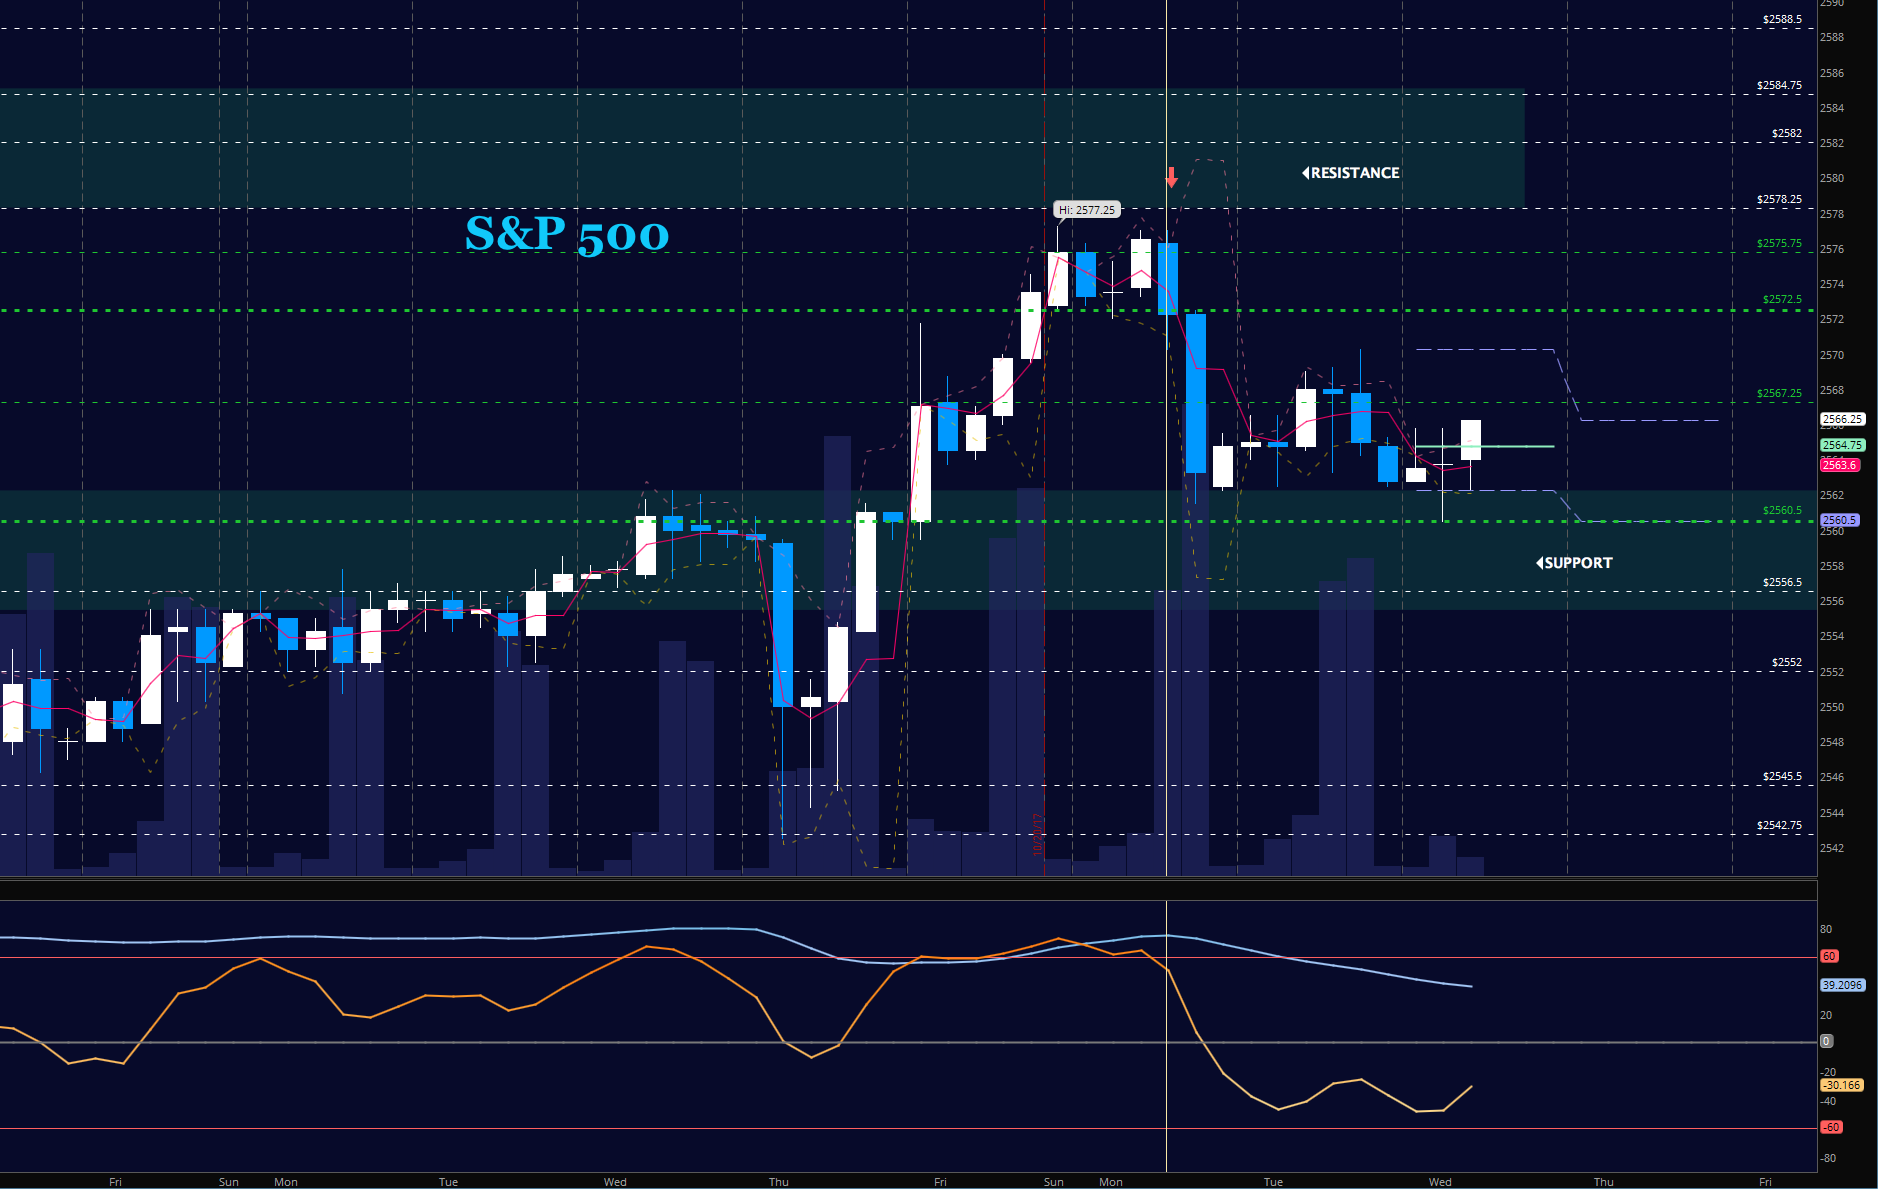
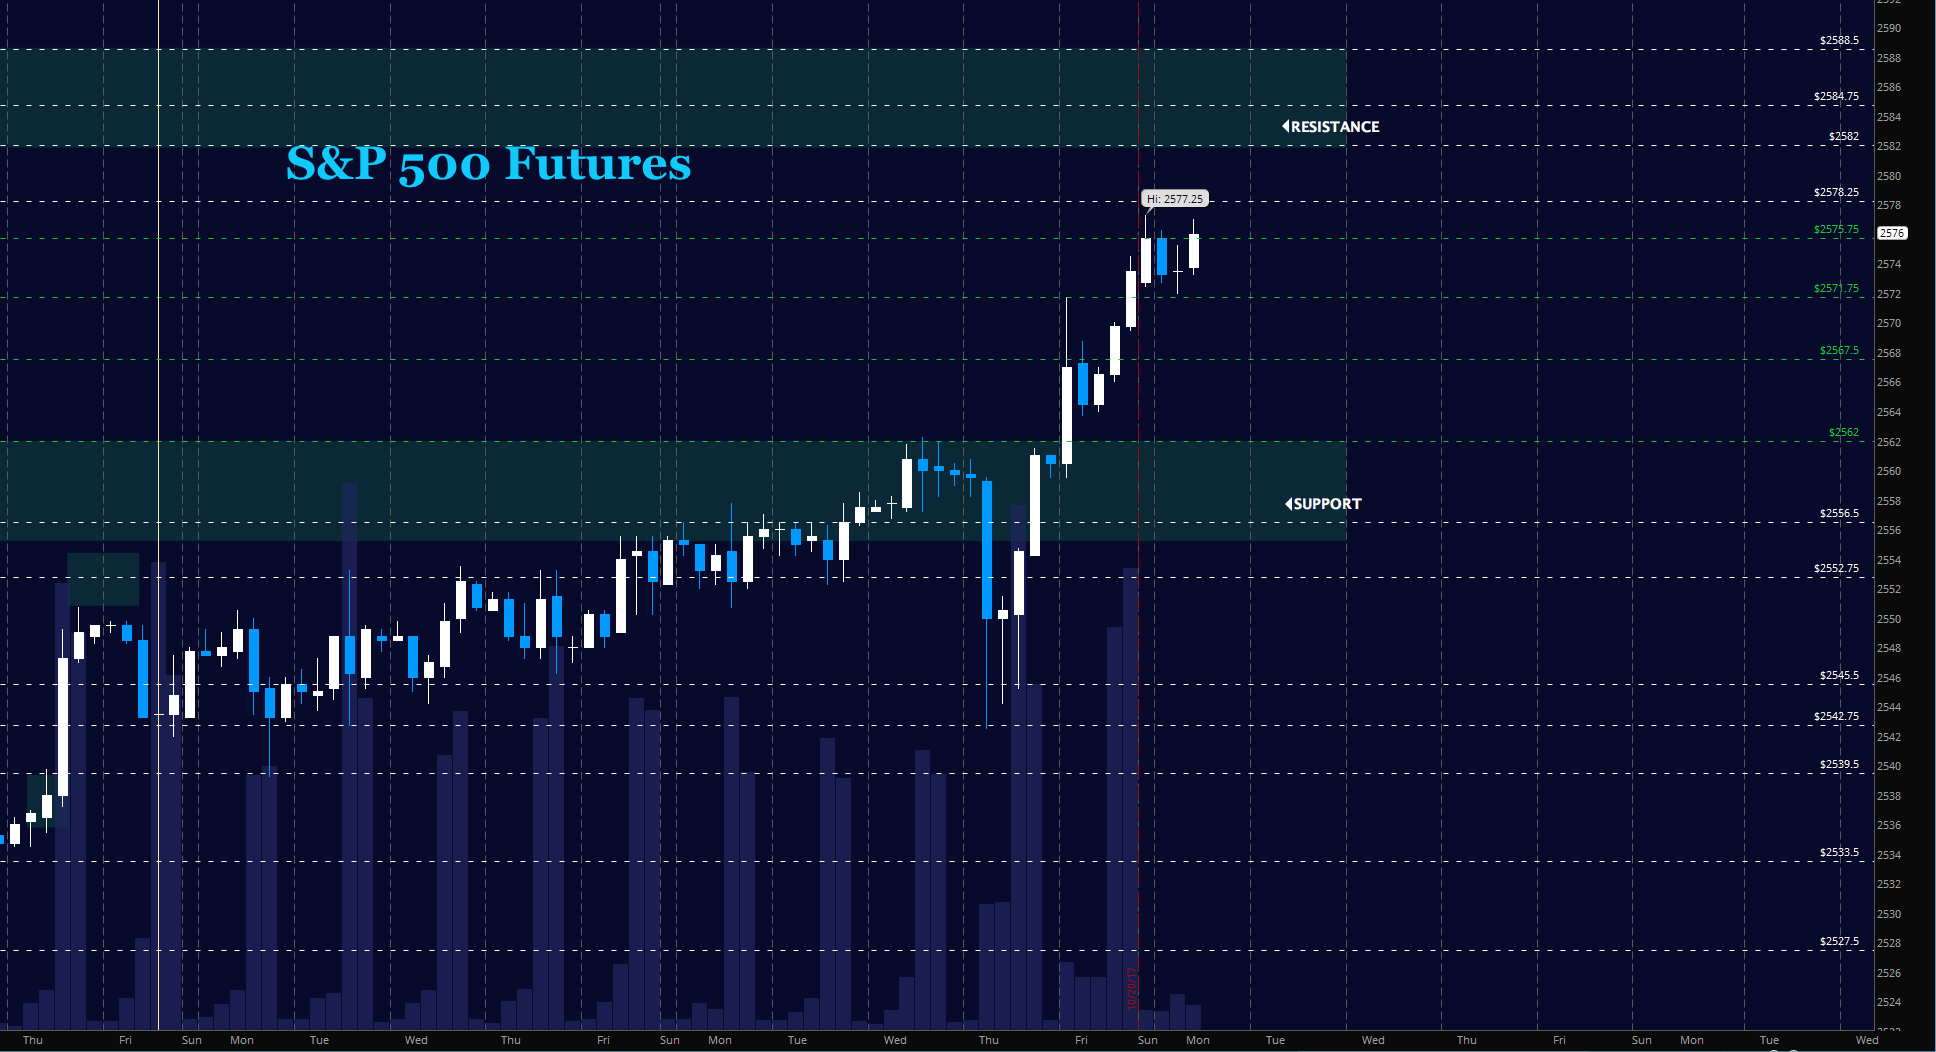
S&P 500 Futures Trading Outlook For October 26
Stock Market Futures Trading Considerations For October 26, 2017
Was yesterday another "buy the dip" occurrence? The steep pullback has seen an equally sharp bounce....
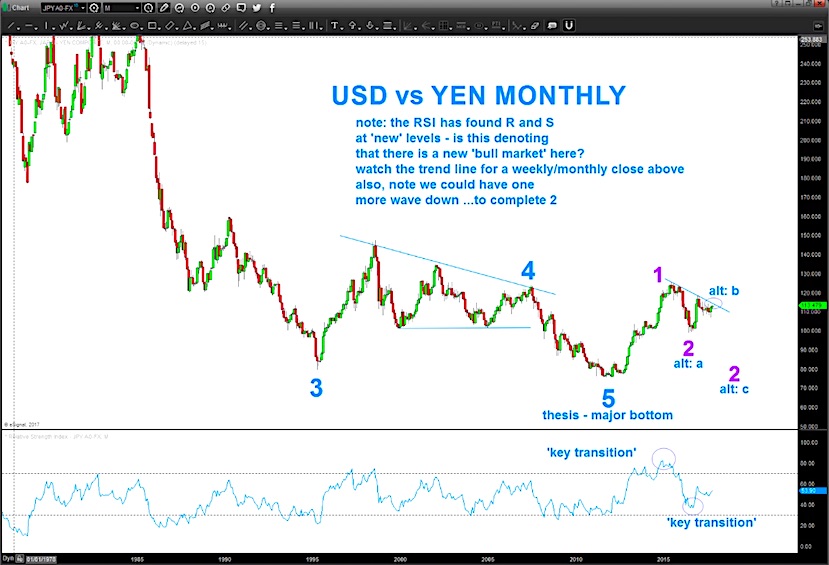
USD/JPY Currency Chart: Is Elliott Wave 2 Over?
I've been watching the US Dollar Index (CURRENCY:USD) and Japanese Yen (CURRENCY:JPY) for many years. And I've had several trading run-ins with the USD/JPY.
Those...
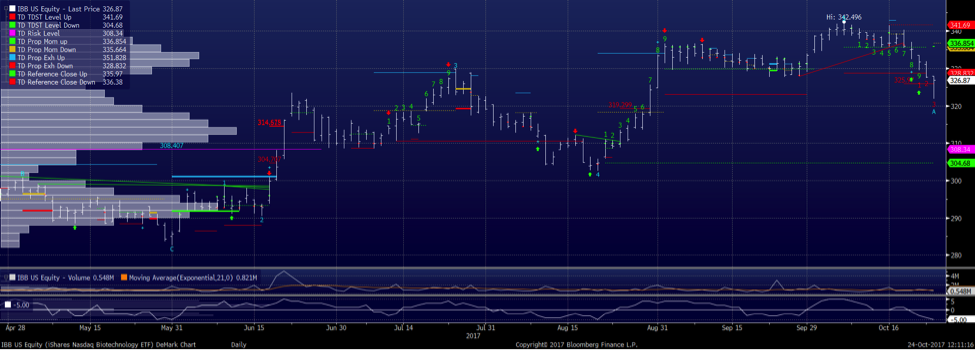
Biotech ETF (IBB) Investing Update: ‘The Trifecta From Hell’
No secret that counting on the predictability of prescription drug prices is slightly less reliable than playing roulette. However, until recently, Wall Street’s animal...
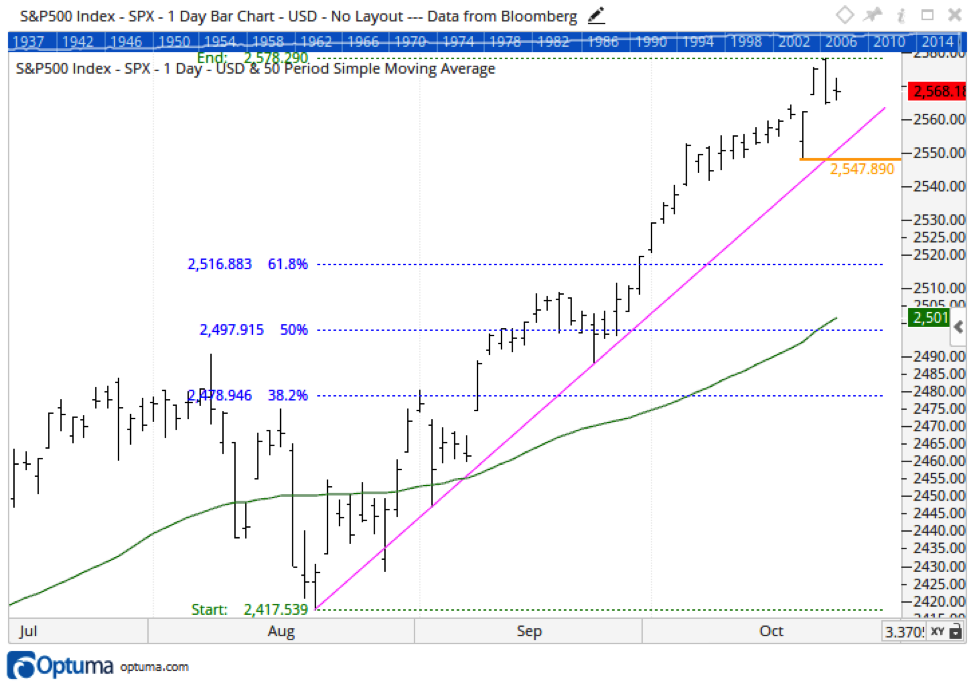
No Need To Panic On Outside Days
The S&P 500 Index (INDEXSP:.INX) put in an outside day on Monday. This deserves respect from traders and investors of all time frames, as well...
Stock Market Futures Trading Update & Outlook – October 25
Stock Market Futures Trading Considerations For October 25, 2017
Stock are trading sideways to lower after seeing a minor bounce yesterday. The S&P 500 (INDEXSP:.INX)...
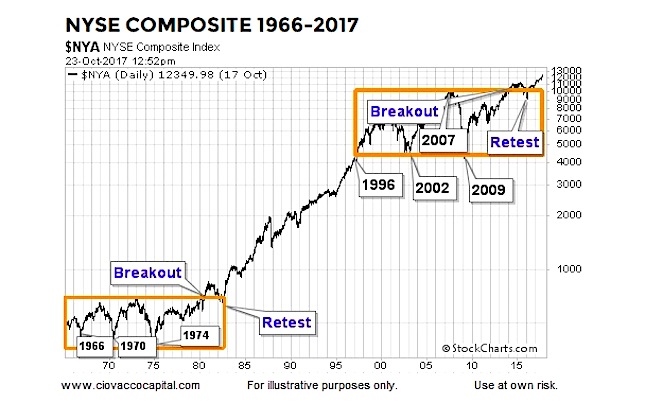
“Very Long-Term View”: Massive Bull Market Breakout
Today we'll take a look at the big picture for stocks... and the implications of a long-term bull market breakout.
The charts will focus on...
S&P 500 Futures Trading Outlook For October 23
Stock Market Futures Trading Considerations For October 23, 2017
The S&P 500 (INDEXSP:.INX) and Nasdaq (INDEXNASDAQ:.IXIC) are inching higher on Monday morning following Friday’s continuation....
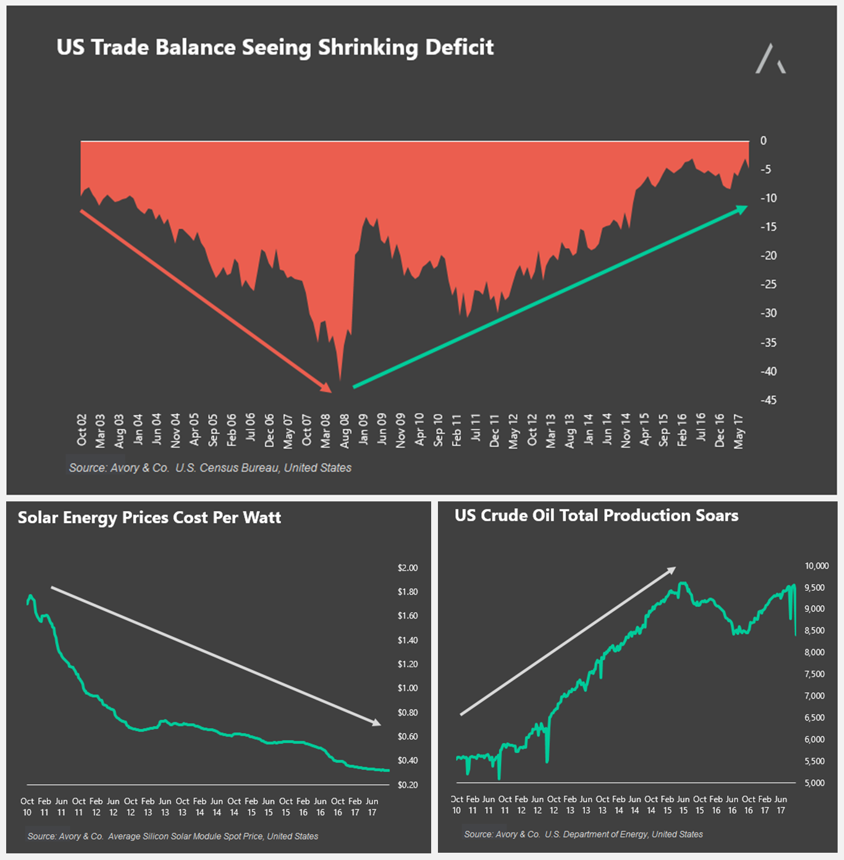
U.S. Energy Trade Deficit Nears Zero As Options Expand
This US energy update was power by data from my firm Avory Research.
The chart highlights the shrinking energy trade deficit, the drop in...

