The S&P 500 Index (INDEXSP:.INX) put in an outside day on Monday. This deserves respect from traders and investors of all time frames, as well as an understanding of what it may mean for your time frame.
As a long-term investor, I’ve built out my technical toolkit to help me capture long-term trends. I’ve also found ways to use shorter-term signals like RSI extremes and candle patterns to better time my entry and exit points.
One of my first “ah-ha” moments in technical analysis was when I learned about outside days.
It’s a simple pattern of two price bars, where the second bar eclipses the range of the first bar. In an uptrend, you’ll see a higher open on the second day, but a lower close.
This indicates a rotation in the supply/demand relationship as traders are pushing the price lower through the course of the trading day. If you’re familiar with candle patterns, you’ll immediately recognize the similarity to a bearish engulfing pattern.
On Monday, the S&P 500 index completed a bearish outside day. How should this impact our short-term and long-term outlook for stocks?
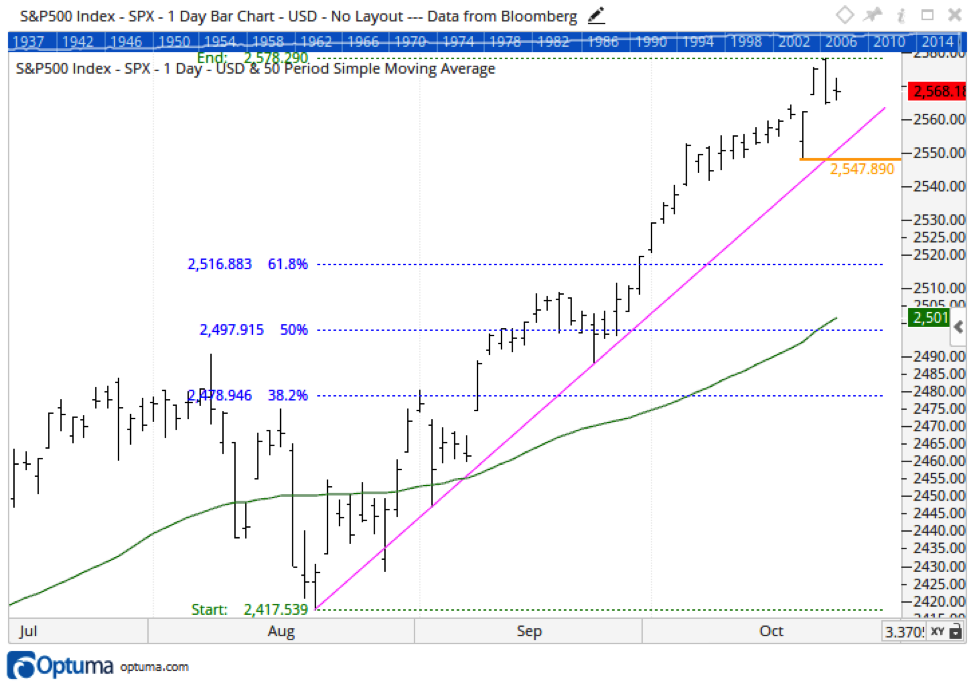
On a short-term basis, this pattern suggests weakness for the index, as it tells us that sellers outweigh buyers. In terms of downside support, the trend line (purple) using the August and September lows is a good visual representation of the recent uptrend. A breakdown through this line would also suggest lower prices ahead. Below that, the previous swing low around 2548 would serve as key short-term support.
The best part of an outside day is it provides a clear “stop loss” for the sell signal. If the S&P closes above the high of the second day (around 2578.30), that would signal an “all clear” and a higher move ahead.
How does this impact the long-term picture of the S&P? Very little. The trend is still higher as long as we continue to see higher lows and higher highs.
If we did see a correction in the coming weeks, I would then look for support at the 50-day moving average (green) as well as the Fibonacci level (blue) around 2517.
But as long as we continue to see higher lows, the trend is up.
Twitter: @DKellerCMT
Any opinions expressed herein are solely those of the author, and do not in any way represent the views or opinions of any other person or entity.


: Showing Some Signs of Emerging Strength")
