Stock Market Futures Trading Considerations For October 26, 2017
Was yesterday another “buy the dip” occurrence? The steep pullback has seen an equally sharp bounce. The S&P 500 (INDEXSP:.INX) and Nasdaq (INDEXNASDAQ:.IXIC) likely to re-test key short-term price resistance today. How buyers react on pullbacks will be important…
Check out today’s economic calendar with a full rundown of releases. And note that the charts below are from our premium service and shared exclusively with See It Market readers.
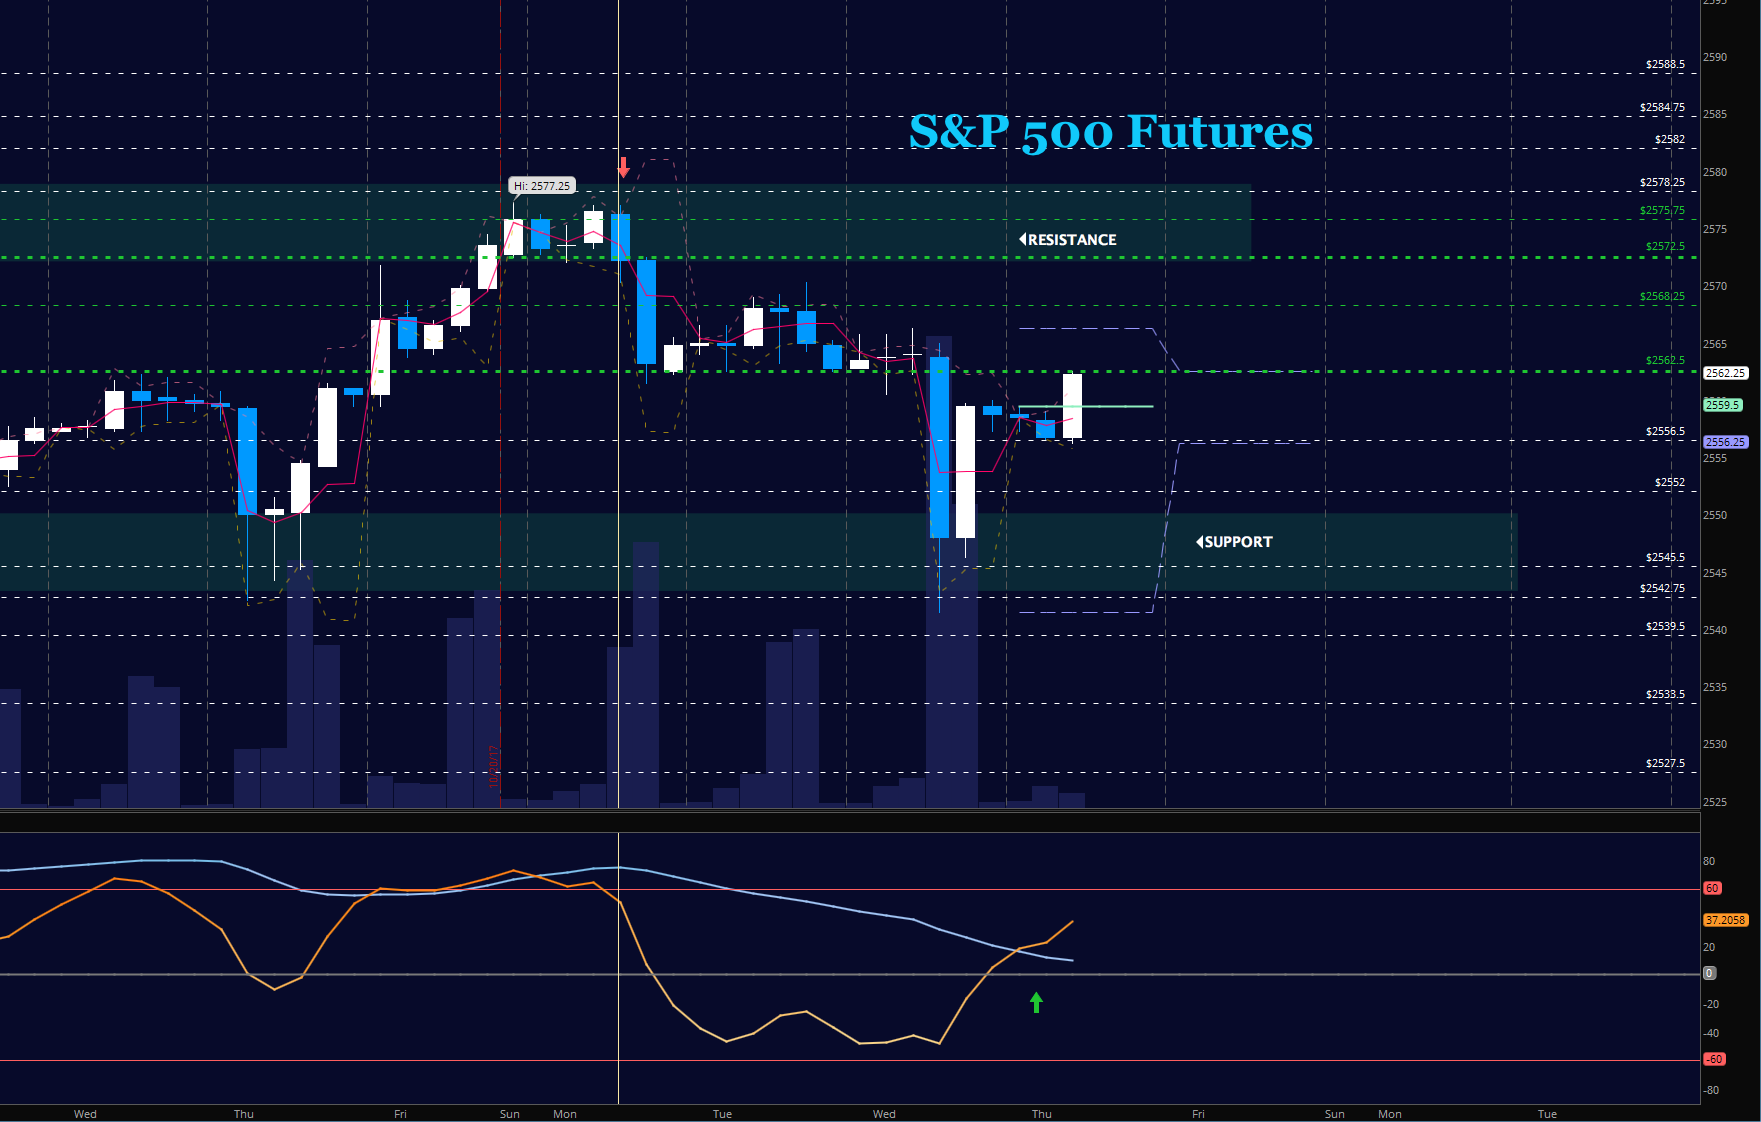
S&P 500 Futures
Sellers battle to keep traders below 2561. Epic premarket battle as news comes across the wires but charts are much more bearish than in times past. Bounces into resistance can be sold. Buyers need to get through 2567 before they can be more confident. The bullets below represent the likely shift of trading momentum at the positive or failed retests at the levels noted.
- Buying pressure intraday will likely strengthen above a positive retest of 2567.75
- Selling pressure intraday will likely strengthen with a failed retest of 2560.5
- Resistance sits near 2567.5 to 2572.75, with 2574.75 and 2577.25 above that.
- Support holds between 2562.25 and 2556.5, with 2554.25 and 2544.5 below that.
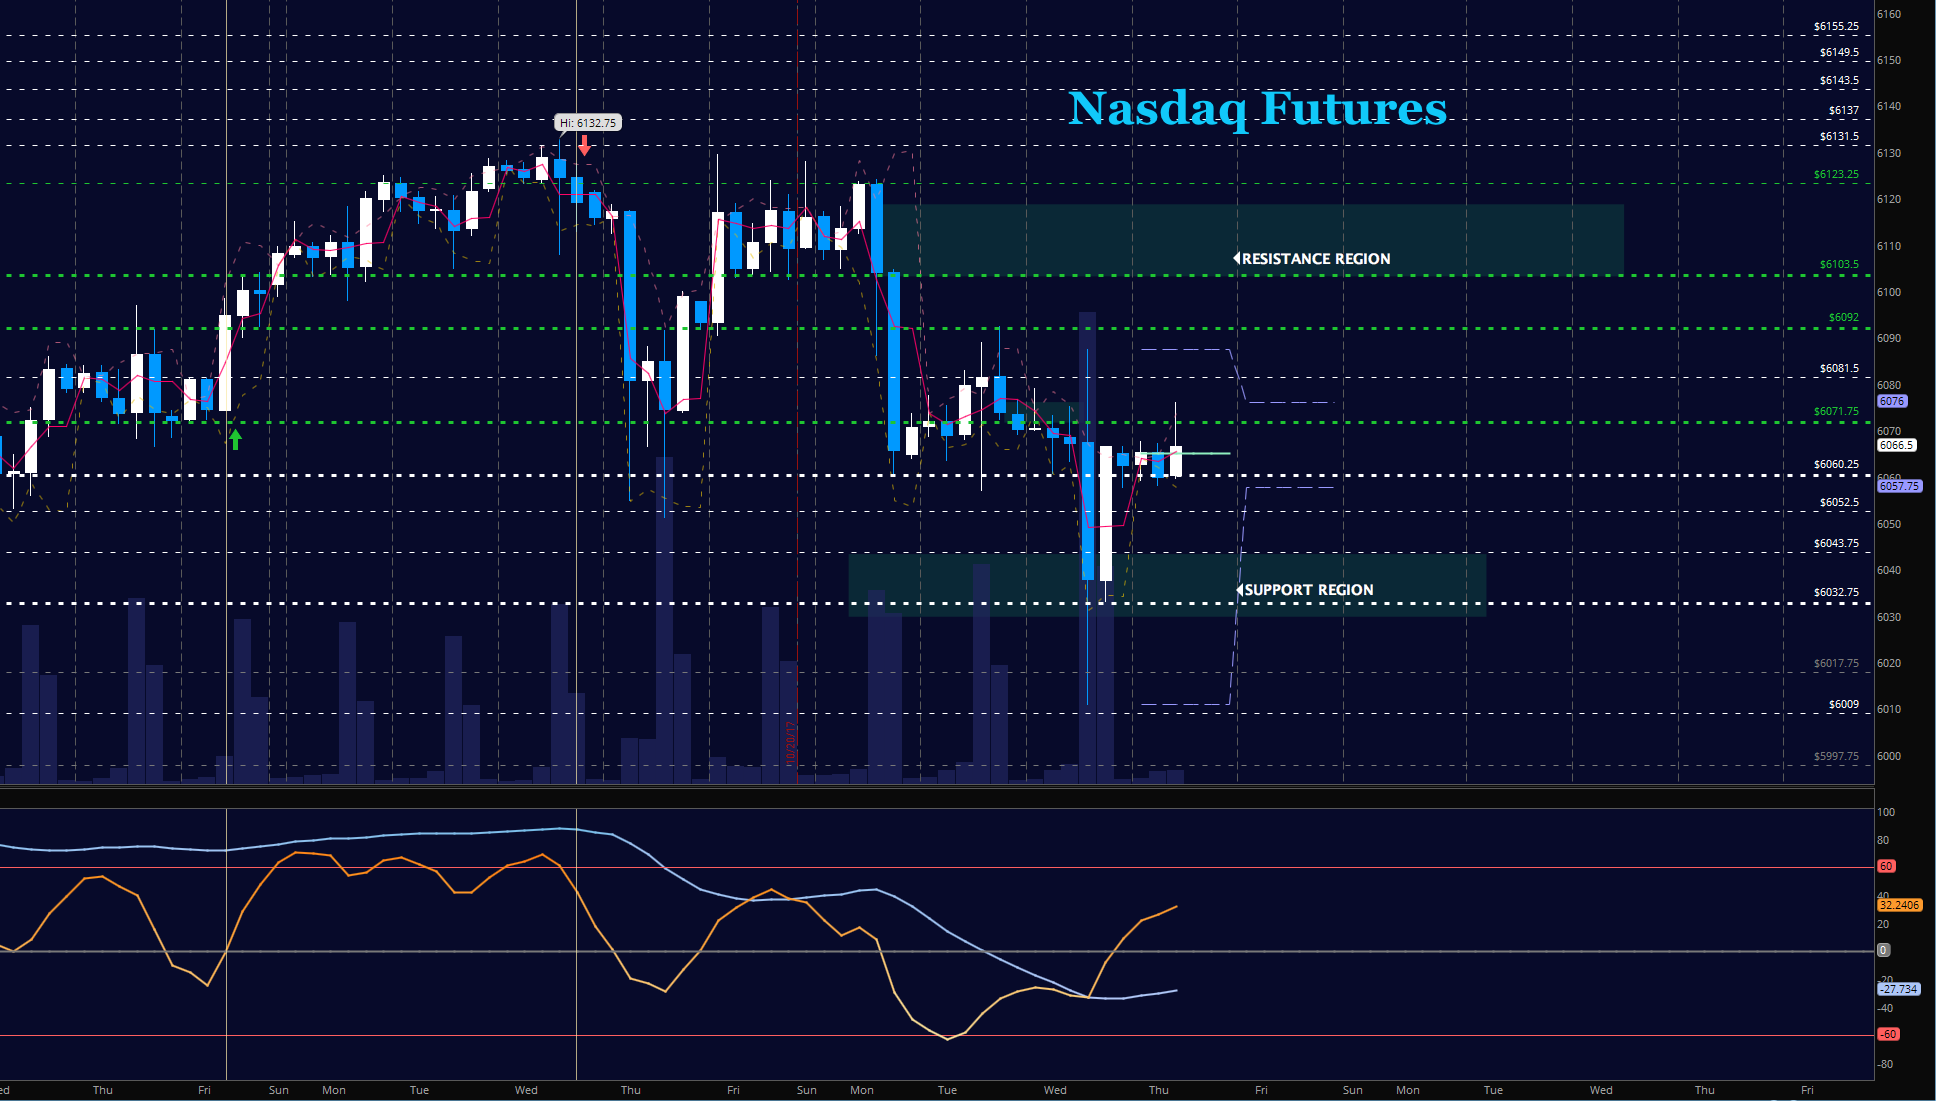
NASDAQ Futures
The NQ moved aggressively south to retest support from days past, and they are failing the morning bounces once more. We certainly are seeing some liquidation here. The levels near 6081 remain resistance. Support now looms near the 6010 region. Below 6057, sellers will continue to be more aggressive. The bullets below represent the likely shift of intraday trading momentum at the positive or failed tests at the levels noted.
- Buying pressure intraday will likely strengthen with a positive retest of 6083.5
- Selling pressure intraday will likely strengthen with a failed retest of 6057.5
- Resistance sits near 6083.25 to 6092.5 with 6103.5 and 6117.5 above that.
- Support holds between 6057.5 and 6043.5, with 6029.75 and 6110.75 below that.
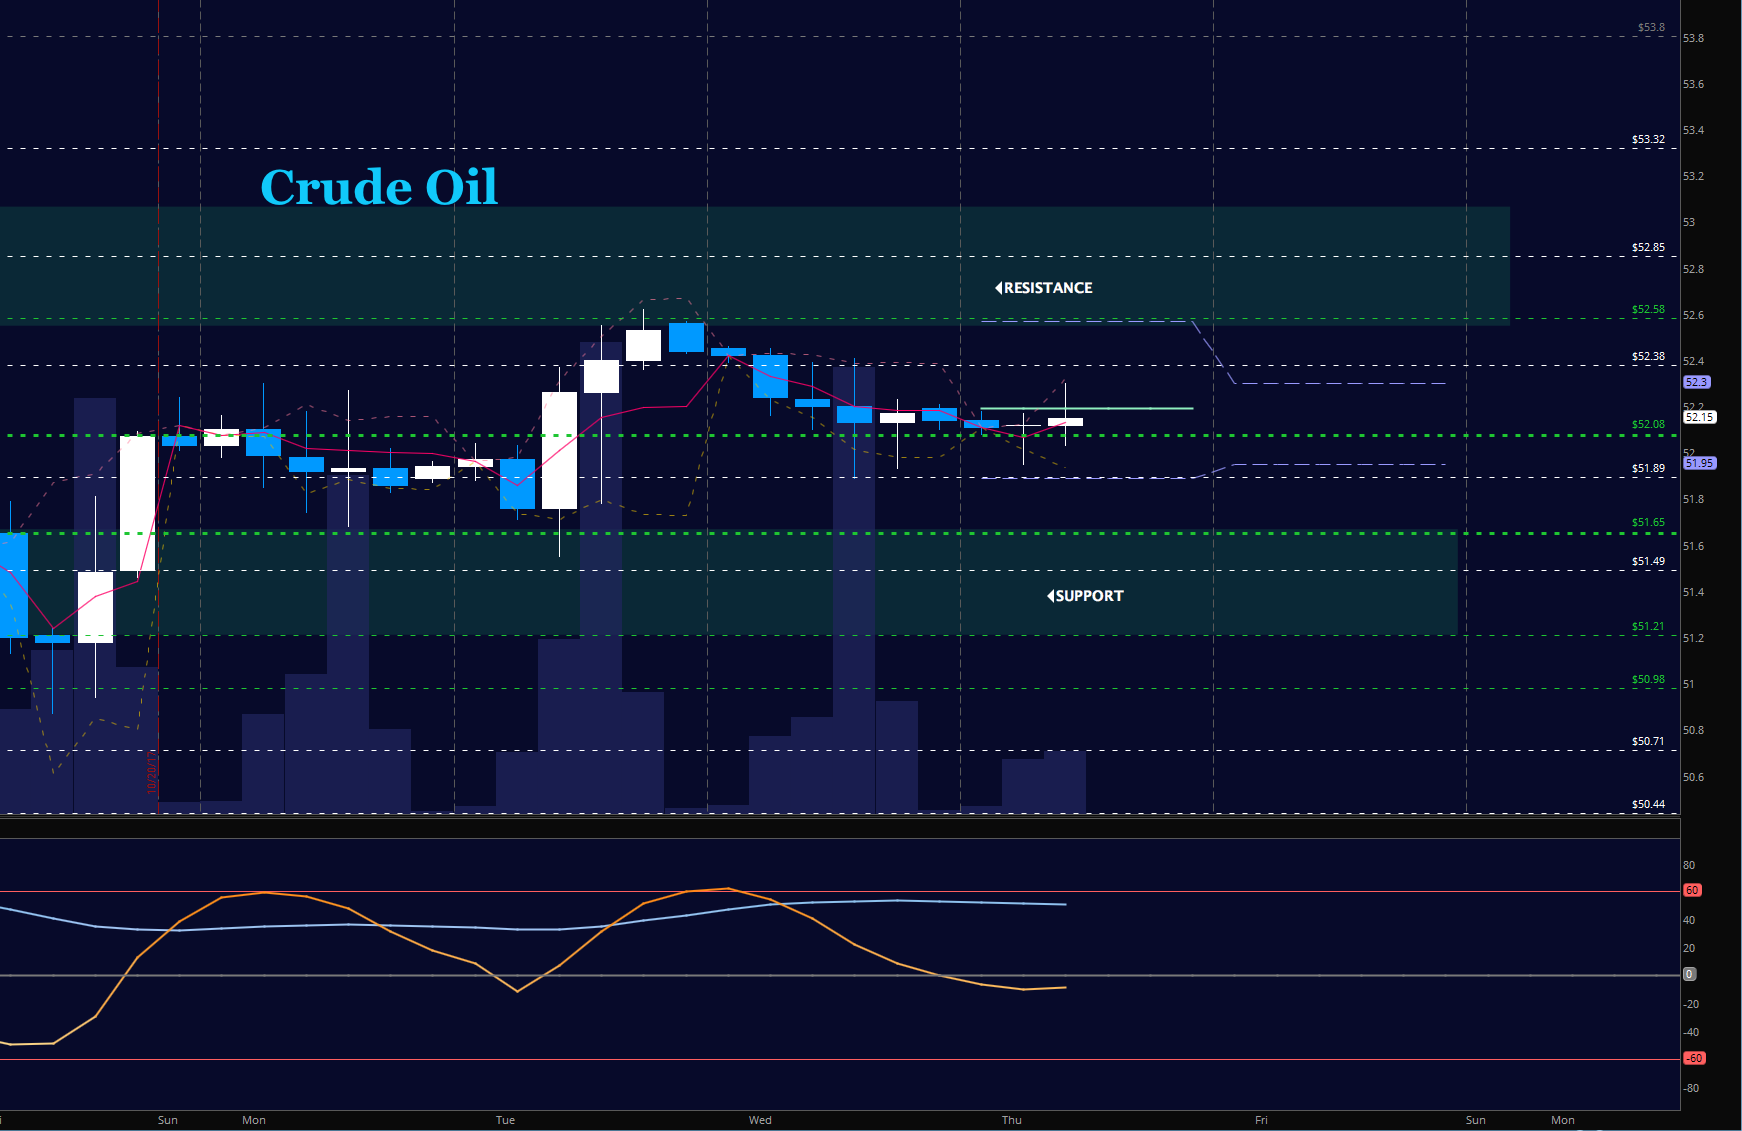
WTI Crude Oil
This chart is landlocked in a 40 tick space. Momentum still shows as more bullish but significant resistance still holds above. The bullets below represent the likely shift of trading momentum at the positive or failed tests at the levels noted.
- Buying pressure intraday will likely strengthen with a positive retest of 52.57
- Selling pressure intraday will strengthen with a failed retest of 51.6
- Resistance sits near 52.4 to 52.62, with 52.85 and 53.32 above that
- Support holds between 51.76 to 51.49, with 51.16 and 50.86 below that.
If you’re interested in the live trading room, it is now primarily stock market futures content, though we do track heavily traded stocks and their likely daily trajectories as well – we begin at 9am with a morning report and likely chart movements along with trade setups for the day.
As long as the trader keeps himself aware of support and resistance levels, risk can be very adequately managed to play in either direction as bottom picking remains a behavior pattern that is developing with value buyers and speculative traders.
Twitter: @AnneMarieTrades
The author trades stock market futures every day and may have a position in mentioned securities at the time of publication. Any opinions expressed herein are solely those of the author, and do not in any way represent the views or opinions of any other person or entity.

: Cup (and Maybe Handle) Watch")
 Trading Near Top Of Price Range")

