The U.S. Dollar is a key variable in all aspects of the marketplace. The strength of the dollar factors into the price we pay for food, gas, and everyday groceries.
It also affects the equity and bond markets as investors factor in the risks of a dollar that is too weak or too strong versus the current economic climate.
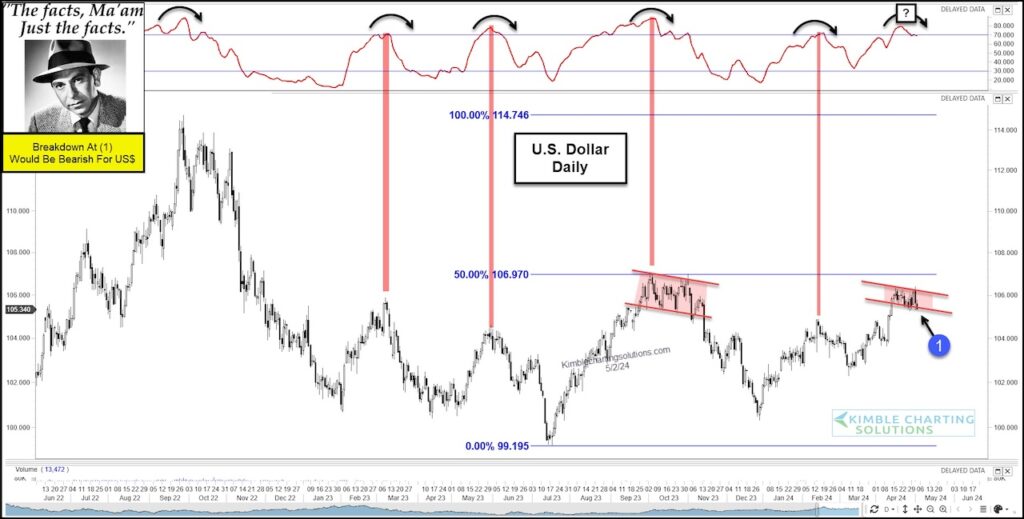
“The facts, Ma’am. Just the facts.” – Joe Friday
So today we look at a chart of the U.S. Dollar and highlight why active investors should be watching the greenback right now.
As you can see, the US Dollar traded into its 50% Fibonacci level again as its momentum is pulling back from historic highs.
In recent years when relative momentum has traded this high, it has marked a top for the US Dollar.
As well, the dollar has formed a sideways consolidation and should it break down at (1), it would send a few bearish message to US Dollar… and perhaps a bullish one to precious metals. Stay tuned!
US Dollar Chart
Note that KimbleCharting is offering a 2 week Free trial to See It Market readers. Just send me an email to services@kimblechartingsolutions.com for details to get set up.
Twitter: @KimbleCharting
The author may have a position in mentioned securities. Any opinions expressed herein are solely those of the author, and do not in any way represent the views or opinions of any other person or entity.

: Cup (and Maybe Handle) Watch")
 Trading Near Top Of Price Range")

