I’ve been watching the US Dollar Index (CURRENCY:USD) and Japanese Yen (CURRENCY:JPY) for many years. And I’ve had several trading run-ins with the USD/JPY.
Those who follow me know that my current working thesis is that the Dollar/Yen currency pair put in a major bottom. So where are we now?
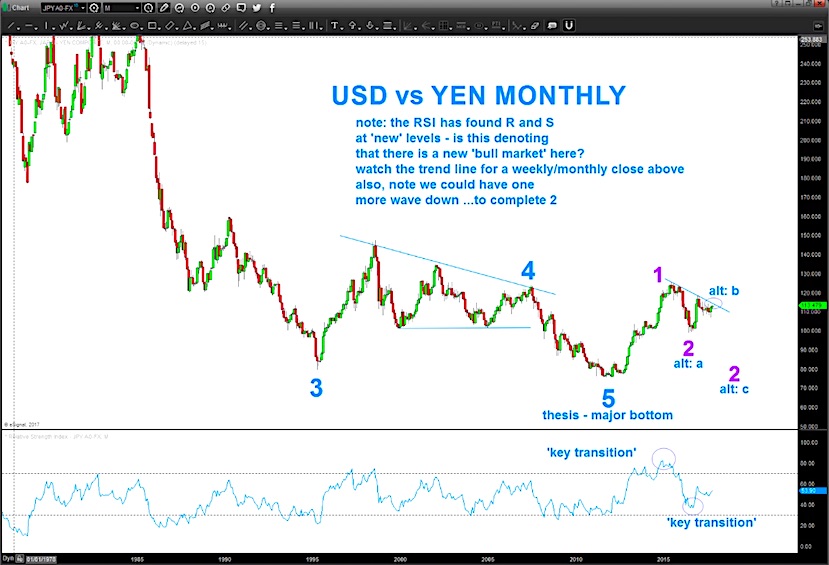
My analysis shows a potential USD/JPY Elliott Wave 2 in the progress. Let’s discuss the chart.
This is a “monthly” bar chart over the long-term. This is not a zoom chart for short-term traders… this is being posted to highlight the macro trend and how to know when a “turn” occurs.
As you can see, Elliott Wave 2 is still pending. A breakout over the downtrend line would be confirmation. If not, it could have one more leg lower. Another move lower, would imply Yen strength… something that hasn’t boded well for US stocks.
Note as well the ‘RSI SHIFT’ (see notes on chart). Though I’m still uncertain about wave 2’s completion, the shift in high/low could very well be implying that a new bull market is here.
Best to simply keep a close eye on the USD/JPY in the days/weeks ahead.
USD/JPY “Monthly” Bar Chart – Elliott Wave 2?
Thanks for reading and good luck out there!
Twitter: @BartsCharts
Author does not have a position in mentioned securities at the time of publication. Any opinions expressed herein are solely those of the author, and do not in any way represent the views or opinions of any other person or entity.


