Stock Market Futures Trading Considerations For October 23, 2017
The S&P 500 (INDEXSP:.INX) and Nasdaq (INDEXNASDAQ:.IXIC) are inching higher on Monday morning following Friday’s continuation. The trend is bullish but expect intraday pullbacks. See our key trading levels for the S&P 500, Nasdaq, and crude oil below.
Check out today’s economic calendar with a full rundown of releases. And note that the charts below are from our premium service and shared exclusively with See It Market readers.
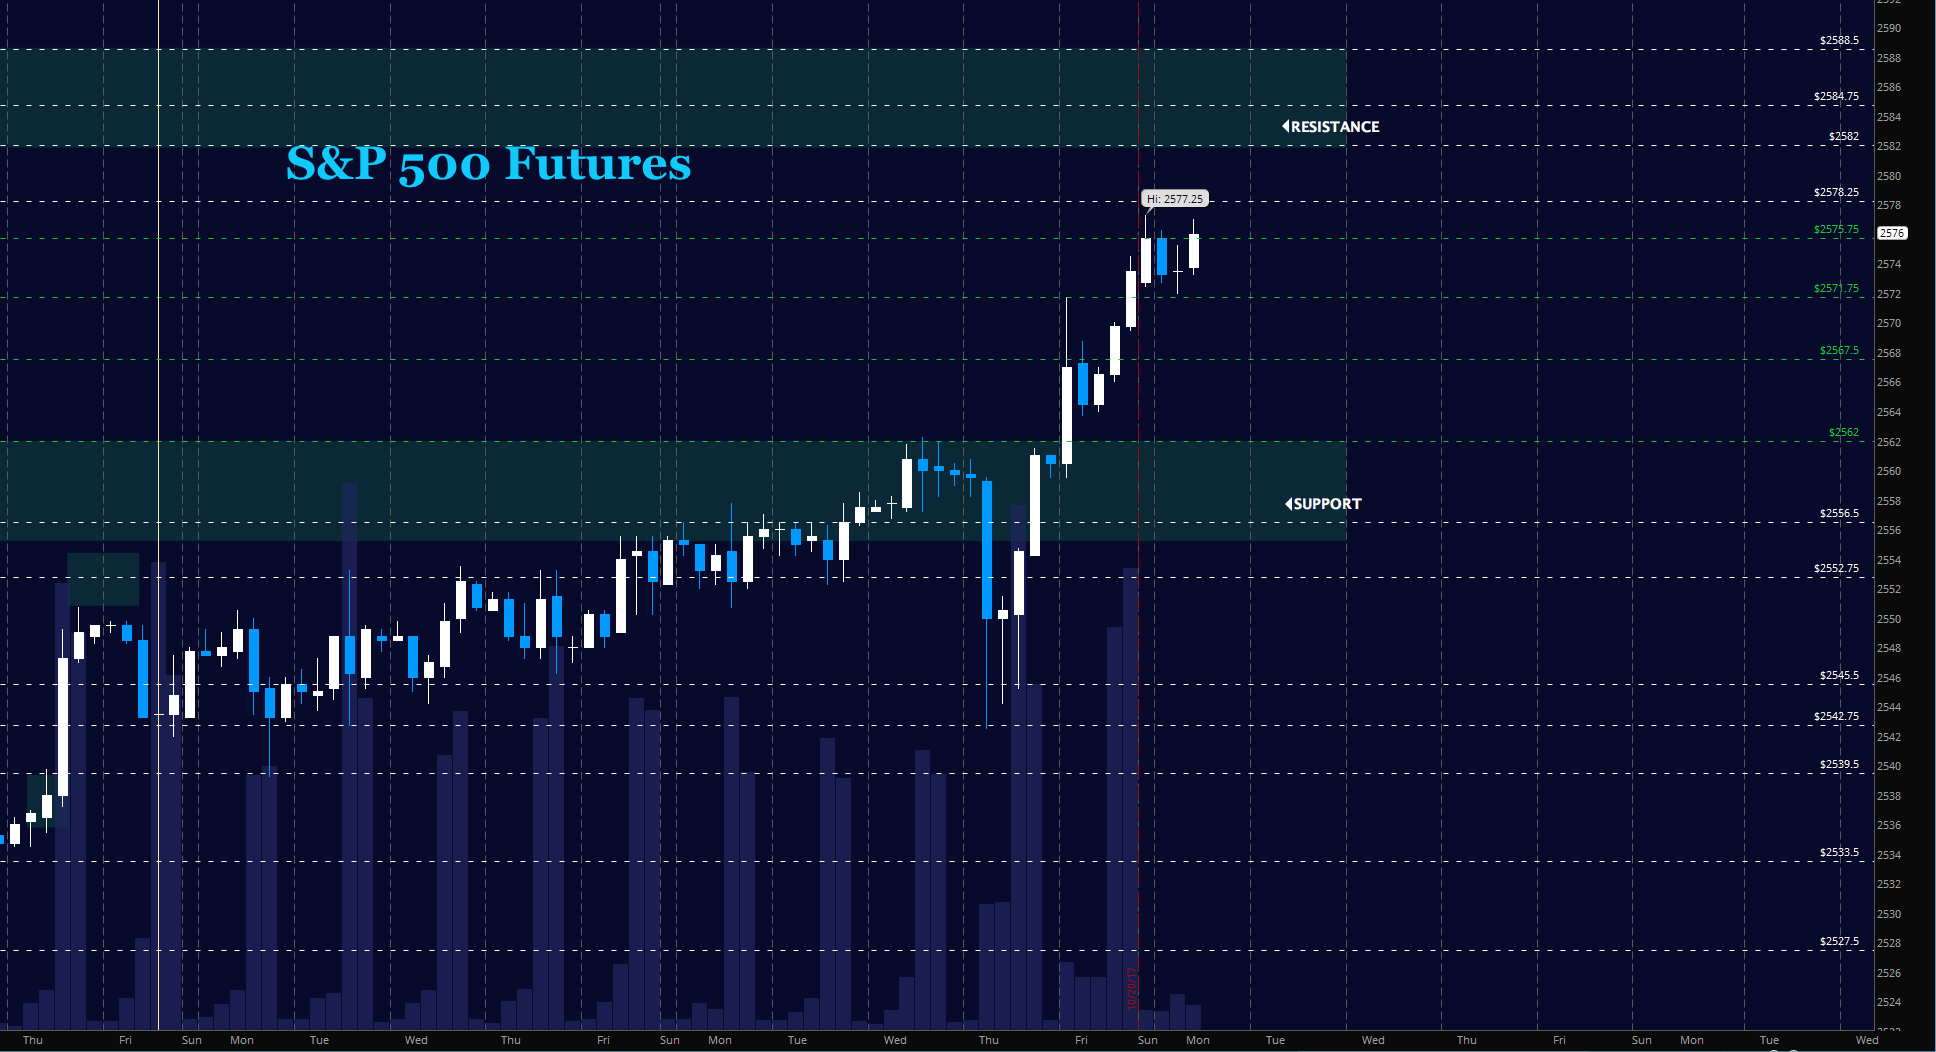
S&P 500 Futures – ES
Buyers continue to hold support and new highs were tested. Shallow pullbacks are likely today as momentum holds steady. Watch for support near 2572 to become resistance before choosing a short trade. The bullets below represent the likely shift of trading momentum at the positive or failed retests at the levels noted.
- Buying pressure intraday will likely strengthen above a positive retest of 2575.75
- Selling pressure intraday will likely strengthen with a failed retest of 2571.5
- Resistance sits near 2578.25 to 2580.5, with 2584.75 and 2587.25 above that.
- Support holds between 2571.5 and 2567.5, with 2562 and 2556.5 below that.
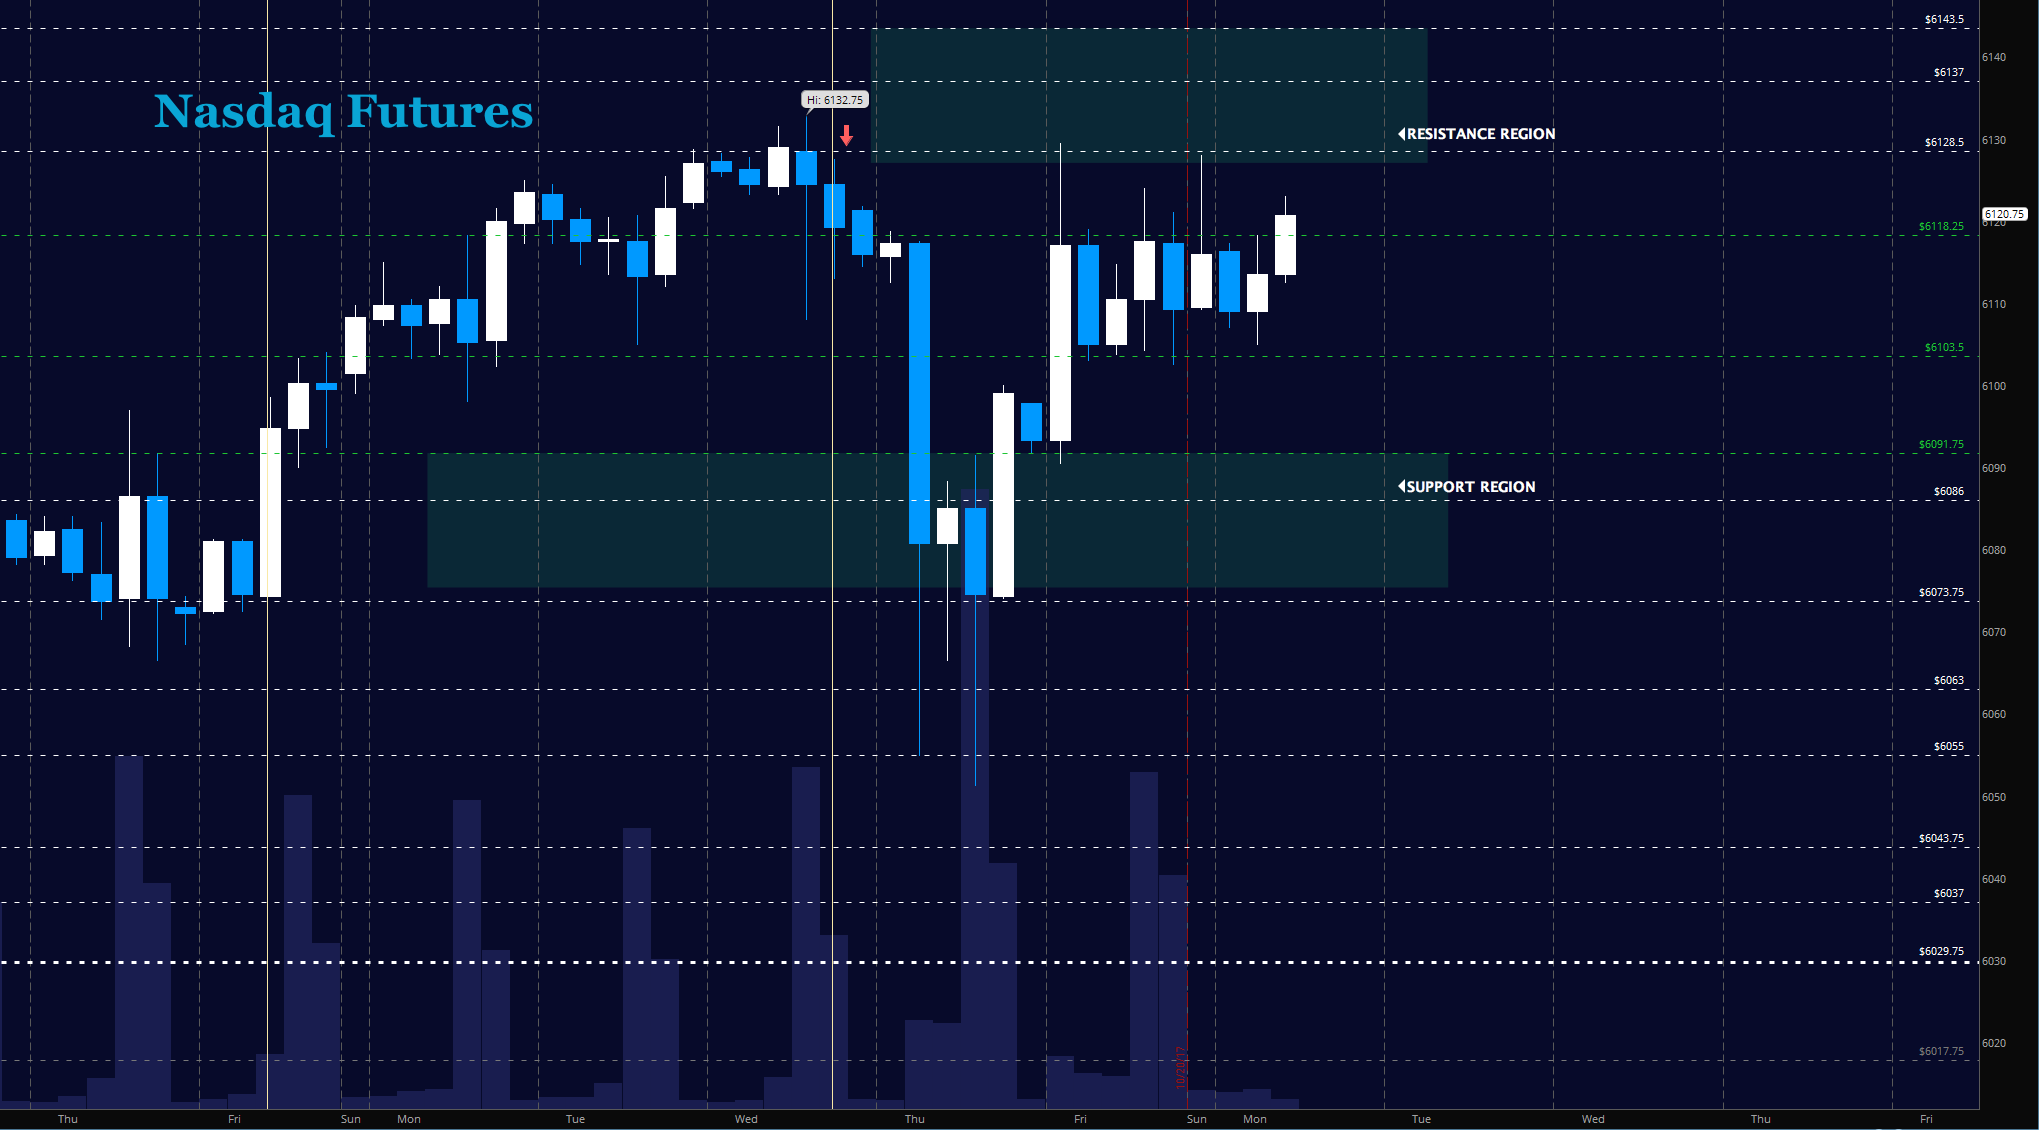
NASDAQ Futures – NQ
The NQ is battling in a range since Friday with overhead resistance near 6128 and has found sellers with each breach above 6118. Holding over 6118 will shift this dynamic and being buyers back. The region near 6104 sits as the lower range of buying support. The bullets below represent the likely shift of intraday trading momentum at the positive or failed tests at the levels noted.
- Buying pressure intraday will likely strengthen with a positive retest of 6118.5
- Selling pressure intraday will likely strengthen with a failed retest of 6103.5
- Resistance sits near 6118.25 to 6128.5 with 6132.5 and 6143.5 above that.
- Support holds between 6105 and 6086, with 6073.75 and 6055 below that.
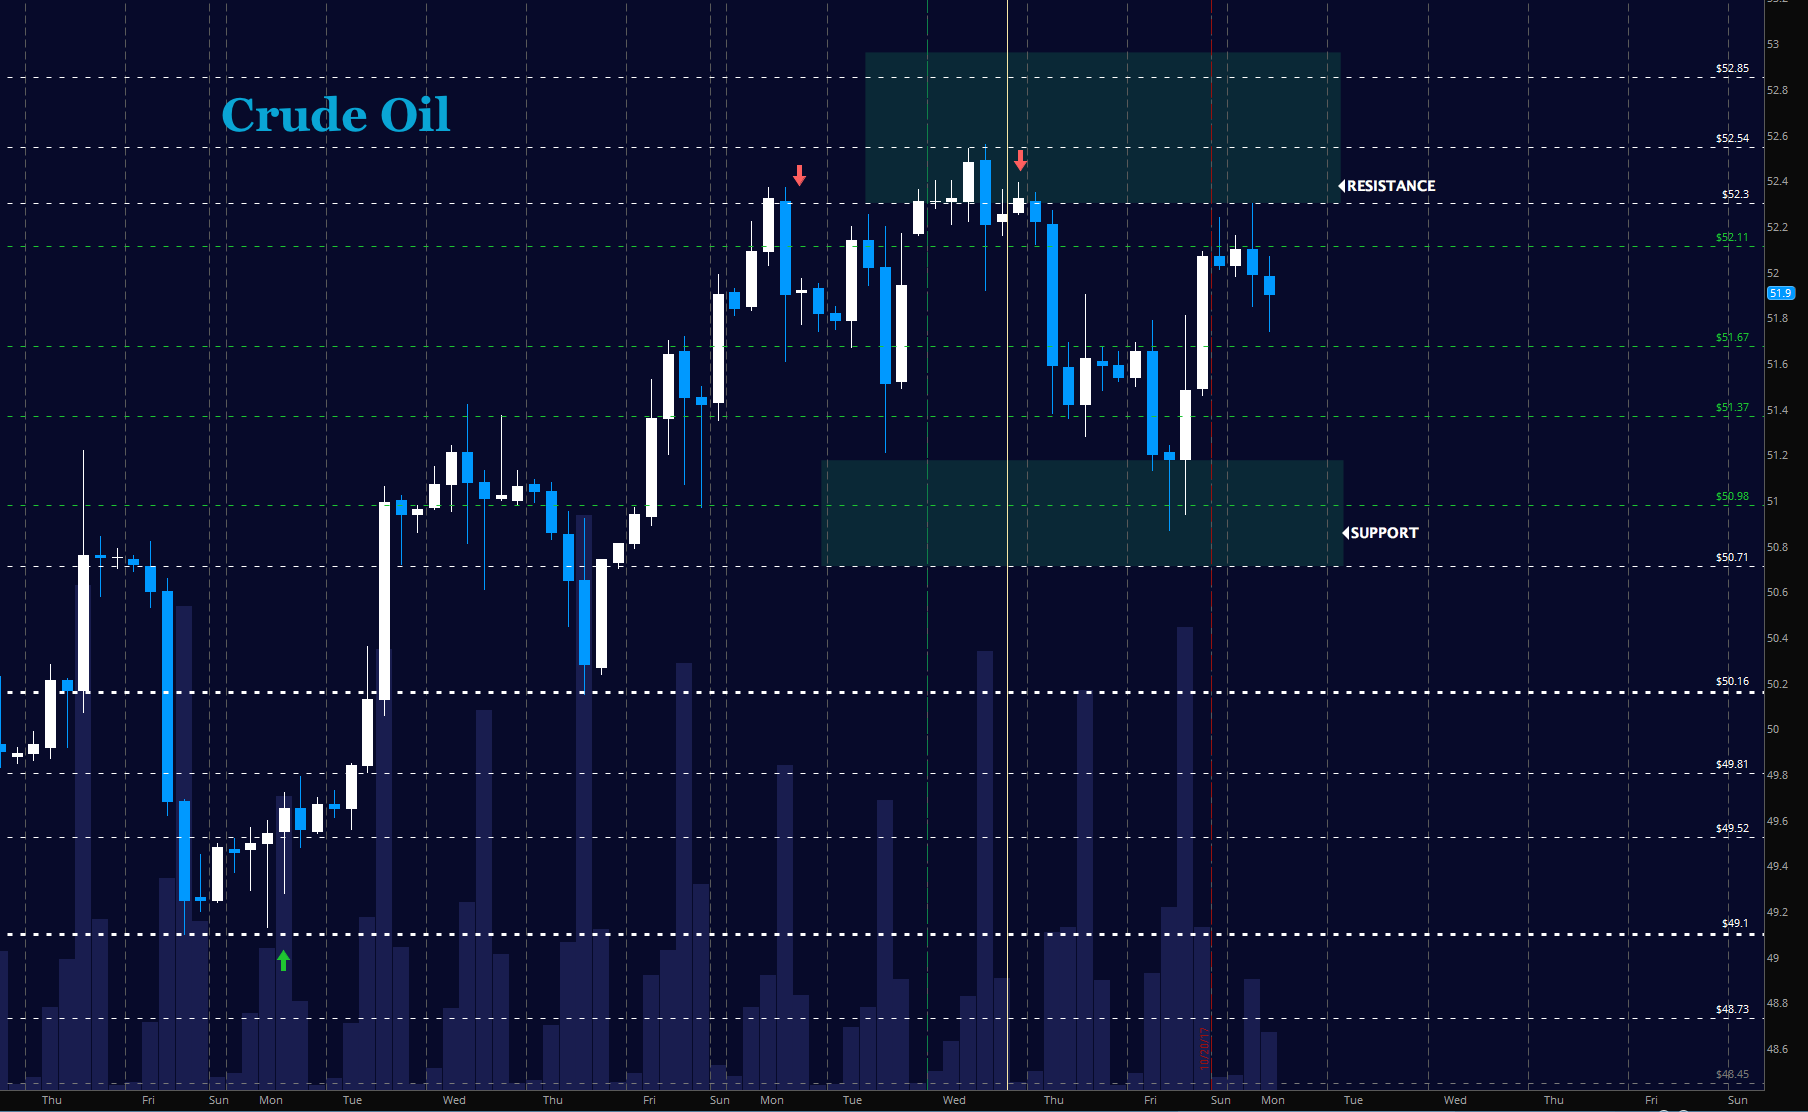
WTI Crude Oil
Oil remains range bound with tests above 52.1 failing and dips into 50.8 bouncing. Momentum shows as mixed between buyers and sellers – with buyers having a slight edge. The bullets below represent the likely shift of trading momentum at the positive or failed tests at the levels noted.
- Buying pressure intraday will likely strengthen with a positive retest of 52.3
- Selling pressure intraday will strengthen with a failed retest of 50.84
- Resistance sits near 52.11 to 52.3, with 52.54 and 52.85 above that.
- Support holds between 50.87 to 50.6, with 50.16 and 49.8 below that.
If you’re interested in the live trading room, it is now primarily stock market futures content, though we do track heavily traded stocks and their likely daily trajectories as well – we begin at 9am with a morning report and likely chart movements along with trade setups for the day.
As long as the trader keeps himself aware of support and resistance levels, risk can be very adequately managed to play in either direction as bottom picking remains a behavior pattern that is developing with value buyers and speculative traders.
Twitter: @AnneMarieTrades
The author trades stock market futures every day and may have a position in mentioned securities at the time of publication. Any opinions expressed herein are solely those of the author, and do not in any way represent the views or opinions of any other person or entity.

")


 Rolling Over At Key Fibonacci Level?")