No secret that counting on the predictability of prescription drug prices is slightly less reliable than playing roulette. However, until recently, Wall Street’s animal spirits have overwhelmed those risks and the prices of biotech / bio-pharma stocks have been pushed to some pretty lofty levels.
Now there’s a heads-up from DeMark indicators that things might be changing, and not only for a quick dip.
Biotech Sector Under the “DeMark” Microscope: The Trifecta From Hell?
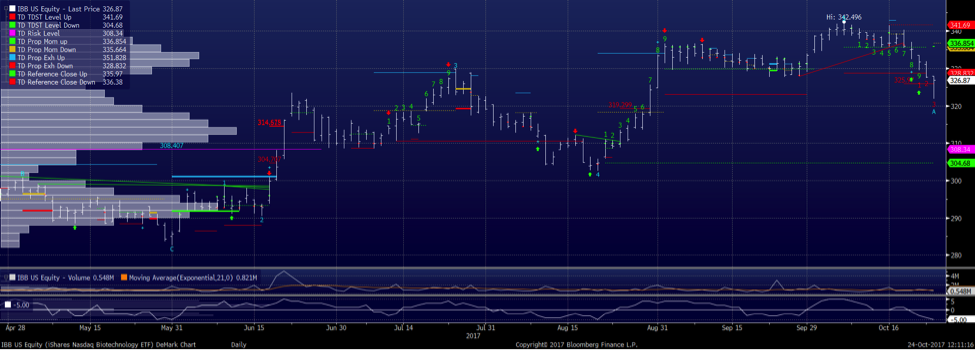
The daily chart of the iShares Nasdaq Biotechnology ETF (NASDAQ:IBB) has completed a TD Buy Setup, the first one since January of this year. The price remains comfortably above TDST Level Down at $304.68, so short term traders may legitimately view the TD Buy Setup signal as the dip to buy. However, completion of a Buy Setup also signals a fair amount of selling pressure.
Biotech ETF (IBB) “Daily” Chart
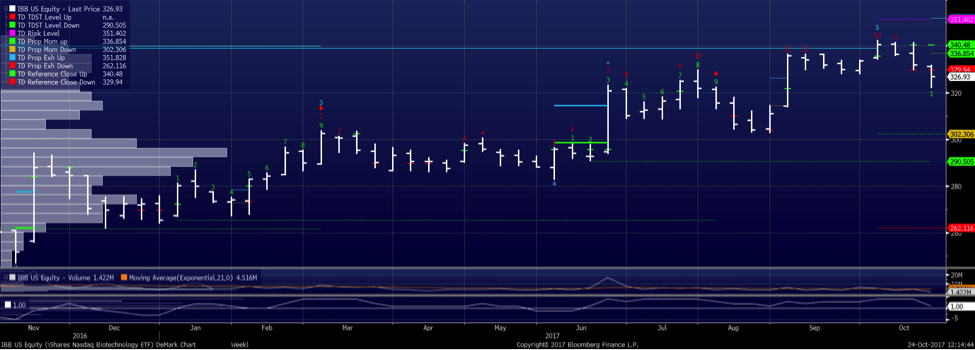
The selling pressure become more evident when looking at the weekly chart. It completed a Countdown Sell 13 three weeks ago (with Risk Level / Secondary Exhaustion at $351.40) and this week looks to be printing a bearish “Price Flip”, i.e. confirmation of the Countdown Sell signal.
Biotech ETF (IBB) “Weekly” Chart
Tying it all together is the monthly chart which shows a likely TD Sell Setup Completion (green Bar 9) as well as a 12 count on the Countdown Sell. Price has also satisfied the TD Prop Exhaustion Up target (thick blue line) at $336.68.
Biotech ETF (IBB) “Monthly” Chart
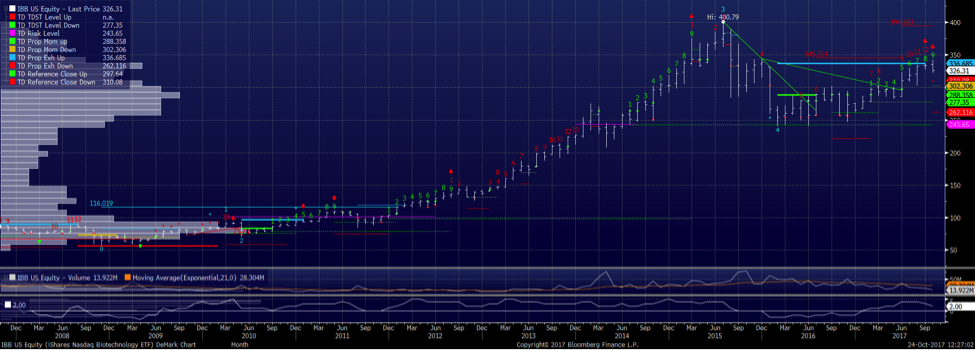
Earlier I said that completion of a TD Buy/Sell Setup is indication of a “fair amount of pressure”, in this case from buyers, and if I were to put on my full bear fur, I’d rather see the Sell Setup cancel (with a monthly close below $310.08). But either way, completion of the Sell Setup and/or Countdown Sell, especially if they occur on a monthly time-frame, does signal caution. You can also see from the chart that all the monthly Sell Setup and Countdown Sell completions since 2009 evolved into in very tradable counter-trend moves.
In sum, there is little doubt in my read of these charts that all three time-frames show buying fatigue, and the alignment of all those time-frames is rare enough to shift the odds squarely in favor of the bears. Of course, the last time I said something similar about McDonald’s (MCD) , it promptly made a fool out of me and it forced me to cut my losses in short order. But that’s why they call this “trading” rather than “winning” and looking for the best odds and keeping our losses small is all we can strive for in this business.
I remain long several biotech names, Gilead Sciences (GILD), Amgen (AMGN), a tiny amount of Celgene (CELG) post the recent crack, Alexion (ALXN), Biomarin (BMRN) and a few other smaller outfits, but all the longs are via defined-risk option strategies. I am outright short the IBB and pressing it with put strategies.
Thanks for reading and good trading to all.
Twitter: @FZucchi
Any opinions expressed herein are solely those of the author, and do not in any way represent the views or opinions of any other person or entity.

: Showing Some Signs of Emerging Strength")
