A couple of months ago I tweeted that McDonald’s stock (NYSE:MCD) was showing signs of DeMark buying exhaustion on daily, weekly and monthly charts.
Just to state the obvious, DeMark indicators tend to be significantly more effective when they align on multiple time-frames. When this happens, they suggest that “swing” traders (those working off of daily charts), “position” traders (followers of weekly charts), and investors (those with time-frames of months and years) are all tapped out from buying, leaving few others to support the price.
If it is true that “tops are processes” and “bottoms are points”, the 6-8 weeks since the stock price showed exhaustion seem indeed to have been the topping process. In the last week or so, all three time frames suggest that a significant drop in price may be in the offing.
Let’s review and analyze McDonald’s stock with DeMark indicators over multiple time-frames…
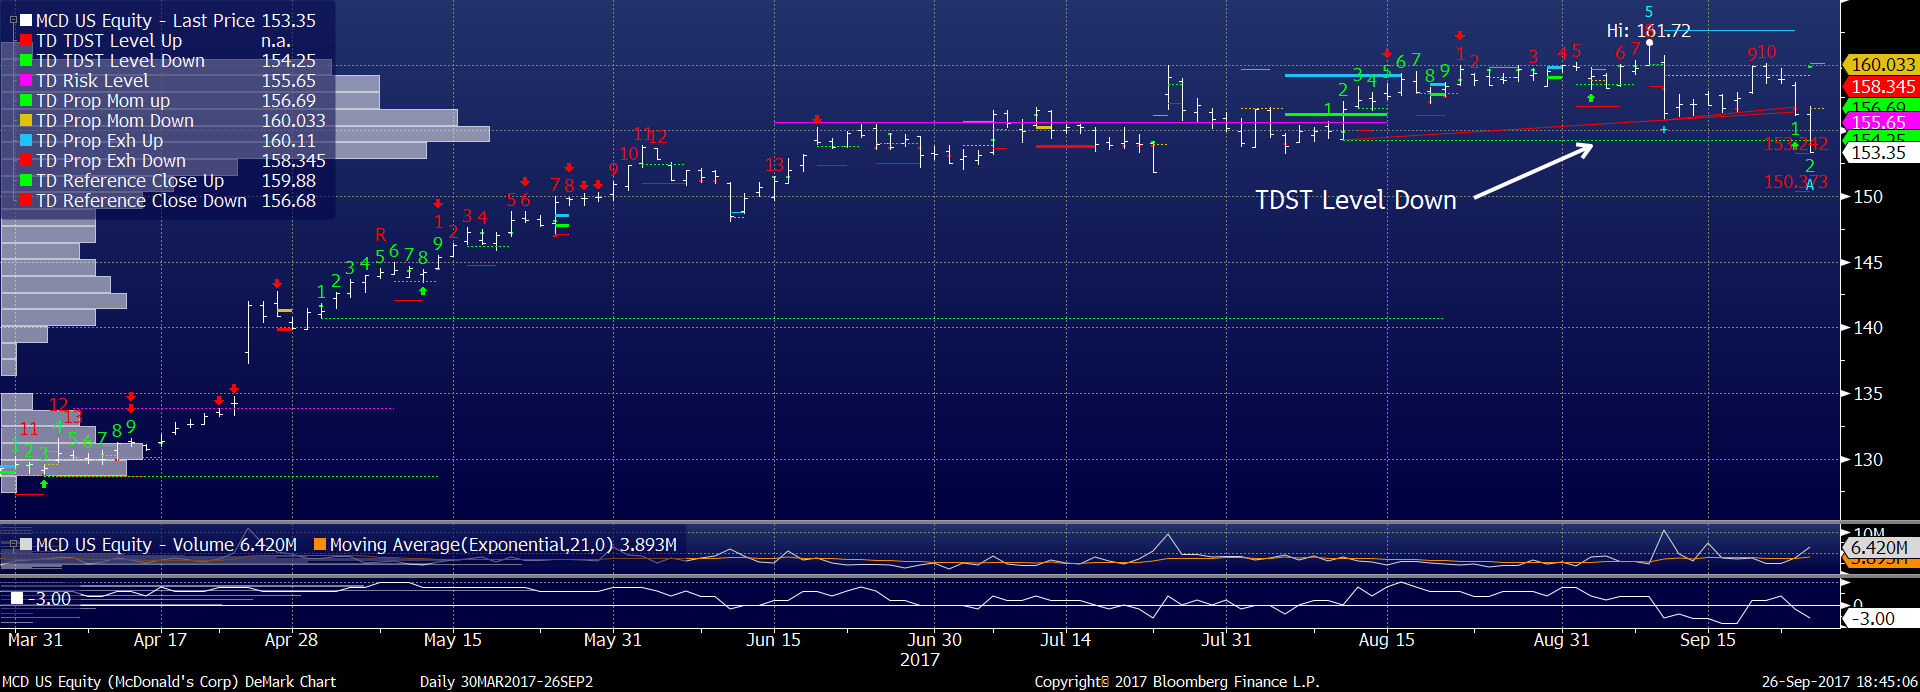
Daily Time-frame – McDonald’s (MCD)
On a daily basis the stock has broken TDST Level Down while only on Bar 2 (out of 9) of a new Buy Setup. When a break happens so early in the Setup process, it increases the odds that a trend-change is in fact in the offing. Furthermore, if the TDST Level break is qualified, it would void the expectation that the still-active Countdown Sell (the latest red numbers on top of the price bars) will unfold to its 13th bar conclusion.
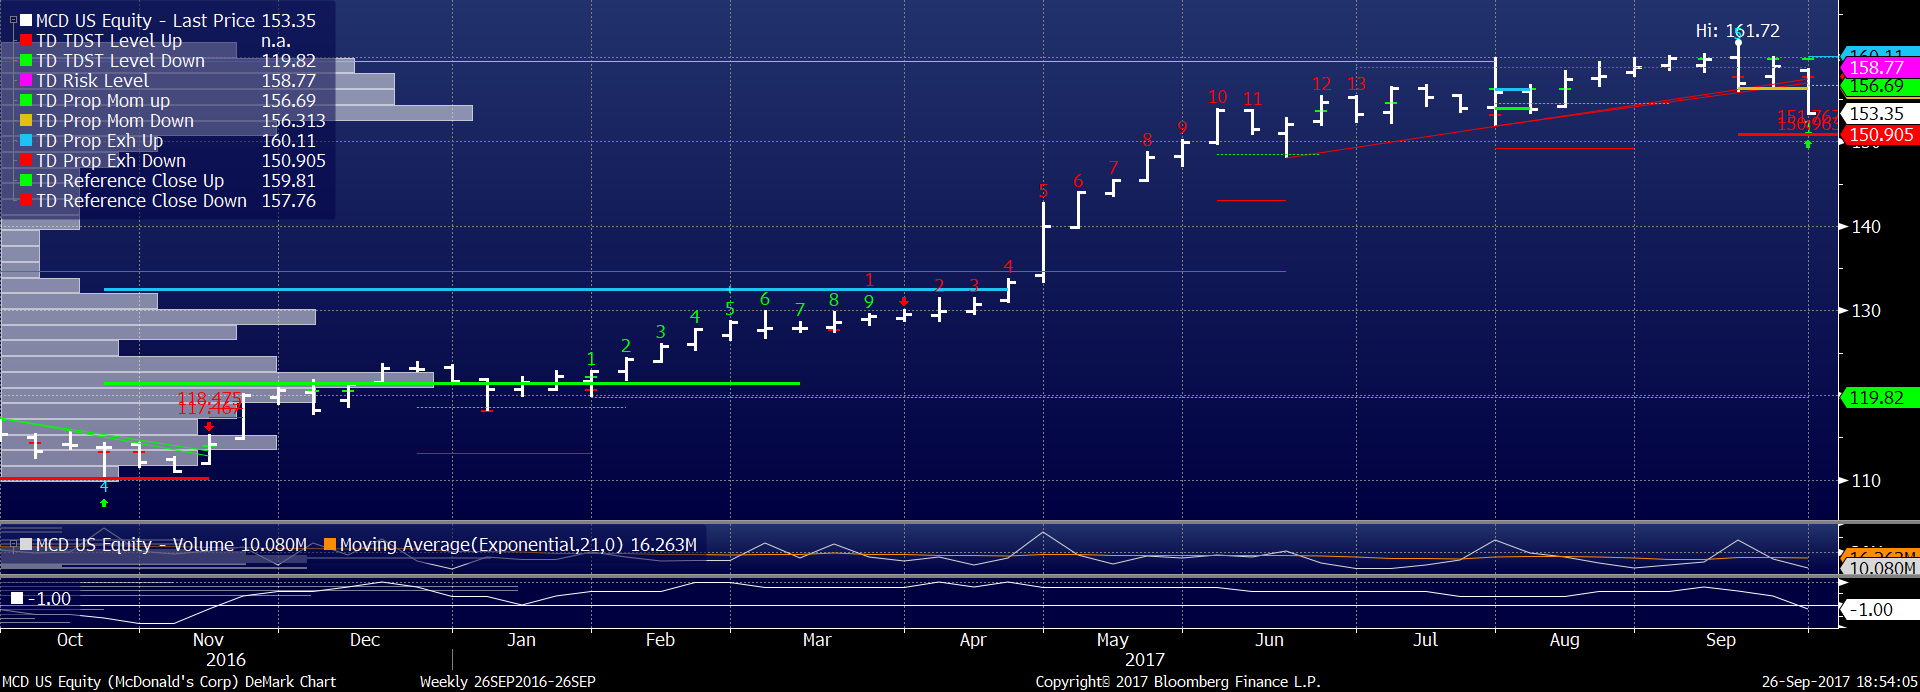
Weekly Time-frame – McDonald’s (MCD)
On the weekly chart, the secondary exhaustion level at $158.77 (purple dotted line) stalled the price rise. More importantly, this week’s action looks to printing a bearish “price flip” (i.e. Bar 1 of a new Buy Setup) which confirms the late June buying exhaustion signaled by the completion of the DeMark Countdown Sell 13 indicator. In addition, the TD Propulsion bars (thick yellow and red bars) have been qualified, which makes the red bar – TD Propulsion Exhaution Down at 150.90 – a “target” level, as opposed to a “support” level.
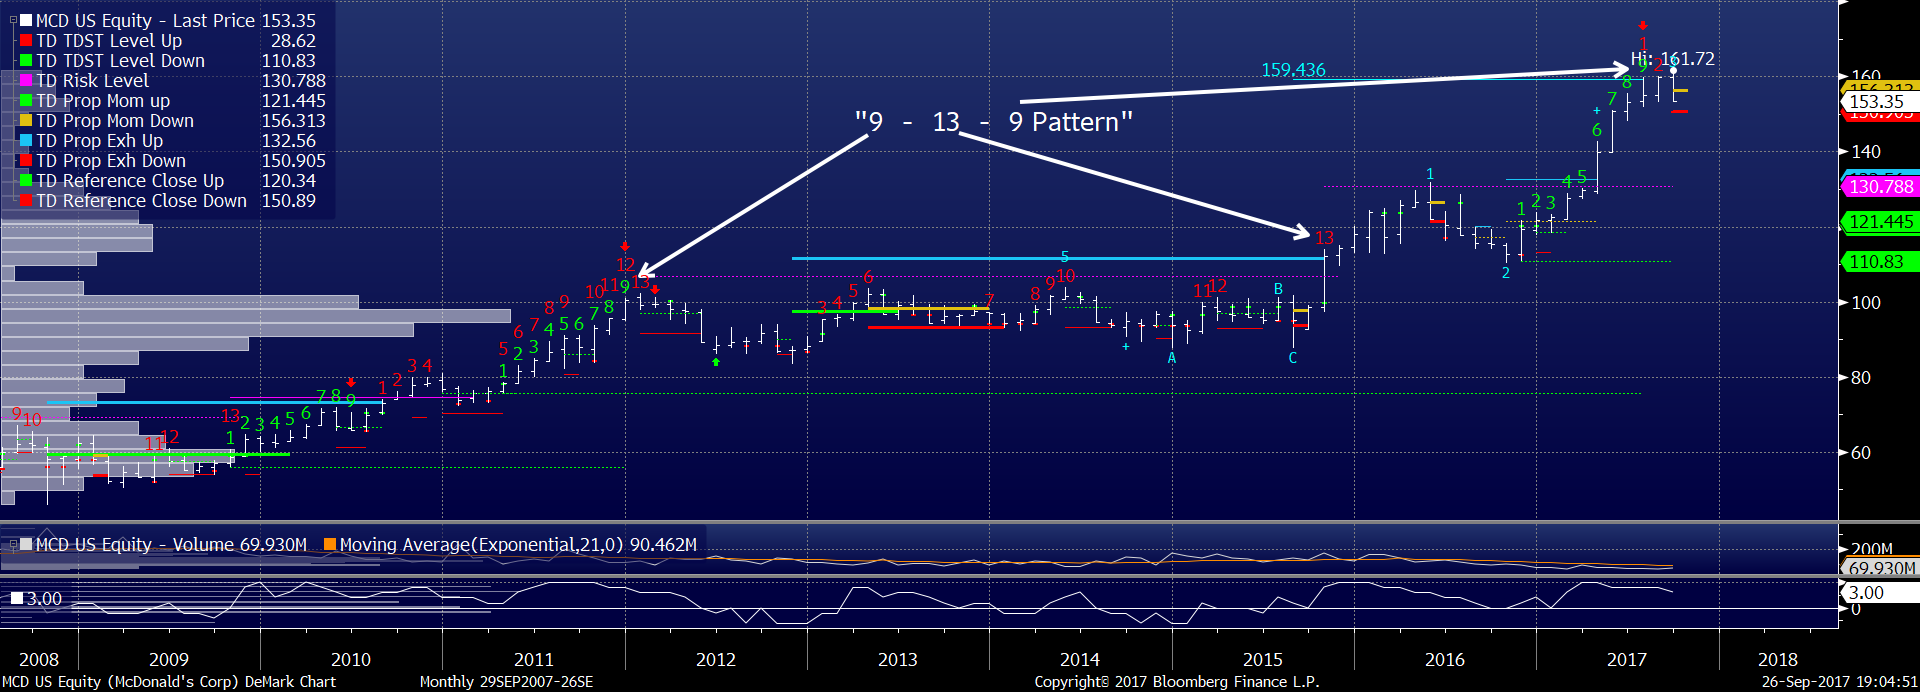
Monthly Time-frame – McDonald’s (MCD)
Finally, even the long-term investors look to have had enough Big Macs. The monthly chart shows a “9-13-9” Sell pattern, one of Tom Demark’s favorite signals to act upon. While it would be ideal to have the “9-13-9” confirmed by a bearish “price flip”, in my opinion the weight of the evidence from the weekly and daily charts is enough not to expect perfection on all three time-frames.
Summary
I have taken a small short position using “diagonal put spreads”. I am using options for three main reasons: first and foremost, they define my risk; second, the implied volatilities for December, January and March expiries are slightly cheap to realized volatility; and third, it spares me the hassle of having to get in and out of a short-stock position when the company goes ex-dividend (I understand that the dividend is priced into the options already, but mentally I don’t like to actually deliver the dividend if I can avoid it).
At what levels will my read of the various charts come in doubt? Without confusing readers with additional DeMark “stuff”, I am planning to add to my short around $156.70 and assume that I am wrong if the price blows through $160.11.
Good luck and thanks for reading.
Twitter: @FZucchi
The author has a position in McDonalds stock (MCD) at the time of publication. Any opinions expressed herein are solely those of the author, and do not in any way represent the views or opinions of any other person or entity.


