Inflation Concerns Easing As Commodities Fall, Bonds Rise
The financial markets have been volatile this year, to say the least. And much of the volatility has been tied to inflationary concerns and...
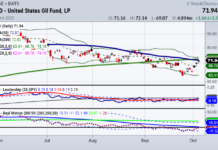
Crude Oil Looks To Be Sending Bearish Message This Month!
Crude oil prices rose sharply in 2022 and this has been a major factor in rising consumer prices and inflation.
But the past five months...
US Dollar Weakness Could Mean Big Things For Stocks and Commodities!
The strength in the U.S. Dollar currency along with treasury bond yields (interest rates) has been relentless all year. And this has pressured stocks...
Markets are shifting, should your trading strategy too?
Mish is at the Money Show, so I am filling in for two days till she returns, and I already managed to miss her Daily...
Oil, Gold, and Equities: The Battle of Supply and Demand
As predicted and we wrote about yesterday, oil prices continued to climb in anticipation of an OPEC+ production cut. Reports confirmed today that OPEC+...
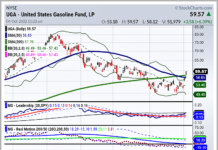
Why Gasoline Prices Matter to the Stock Market
It's no secret that gas prices significantly impact the economy, discretionary spending, and stock market prices.
Gas prices were at record highs following an incredible...
September Market Insights, Stock Calls, and a Look Ahead
As we move into October soon, I wanted to take a moment to highlight some of my recent daily columns from September.
On September 13,...
Are Crude Oil Prices Creating A Double Top Price Peak?
Consumers have taken notice to falling gas prices... and they like it.
But will gas prices continue to fall? For that to happen, consumers (and...
Energy Sector ETF (XLE) Trading in Price Compression Zone
The decline in crude oil prices has been swift. For bullish traders, this has been painful... for consumers, this has provided relief at the...
Crude Oil Declines Into Important Price Support!
One of the most visible signs of inflation is gas prices. And, as you know, the price of gas is born out of the...


