One of the most visible signs of inflation is gas prices. And, as you know, the price of gas is born out of the price of crude oil.
Well, consumers have seen a small decline from the peak in gas prices earlier this year. But could prices fall much lower and further alleviate fears of inflation?
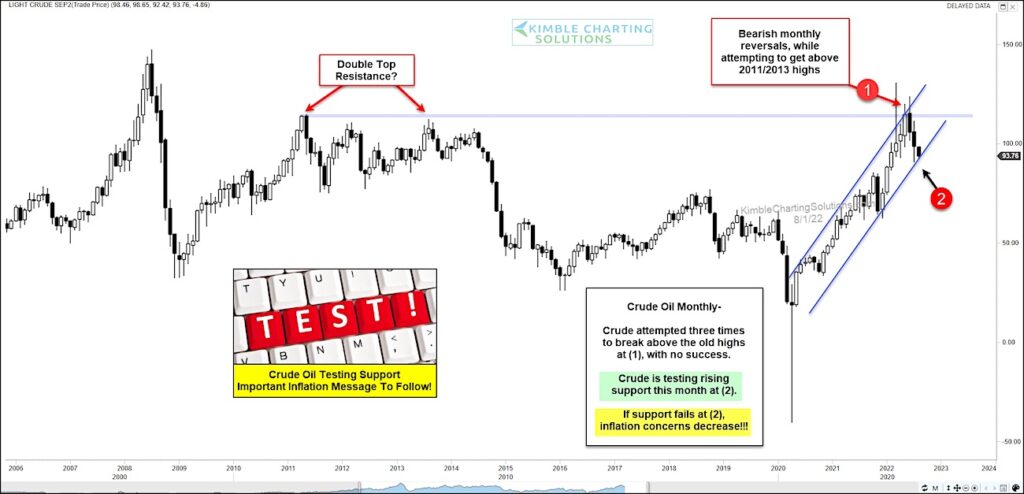
Today’s chart looks at this subject. Below is a “monthly” chart of Crude Oil.
As you can see, crude oil reached up important dual resistance earlier this year before reversing lower at (1). That resistance was marked by a decade’s old double top as well as the top of the current rising trend channel.
The recent decline lower has taken crude oil to the bottom of the rising trend channel at (2). This appears to be an important support test for crude… and consumers!
An important inflation message will be sent depending on what happens from here! Stay tuned!
Crude Oil “monthly” Price Chart
Note that KimbleCharting is offering a 2 week Free trial to See It Market readers. Just send me an email to services@kimblechartingsolutions.com for details to get set up.
Twitter: @KimbleCharting
Any opinions expressed herein are solely those of the author, and do not in any way represent the views or opinions of any other person or entity.

: Worrisome to Broader Market?")

