The banks and financial stocks are trading sideways… and well off the highs of the year.
Will the current trading action in the Financial Sector ETF (XLF) prove worrisome for the broader stock market?
The financial sector plays an important role in the stock market so perhaps it is worth taking a look at (or at least considering in your pros/cons allocation).
Today, we look at XLF and highlight its under-performance, as well as a key price resistance level.
Note that the following MarketSurge charts are built with Investors Business Daily’s product suite.
I am an Investors Business Daily (IBD) partner and promote the use of their products. The entire platform offers a good mix of tools, education, and technical and fundamental data.
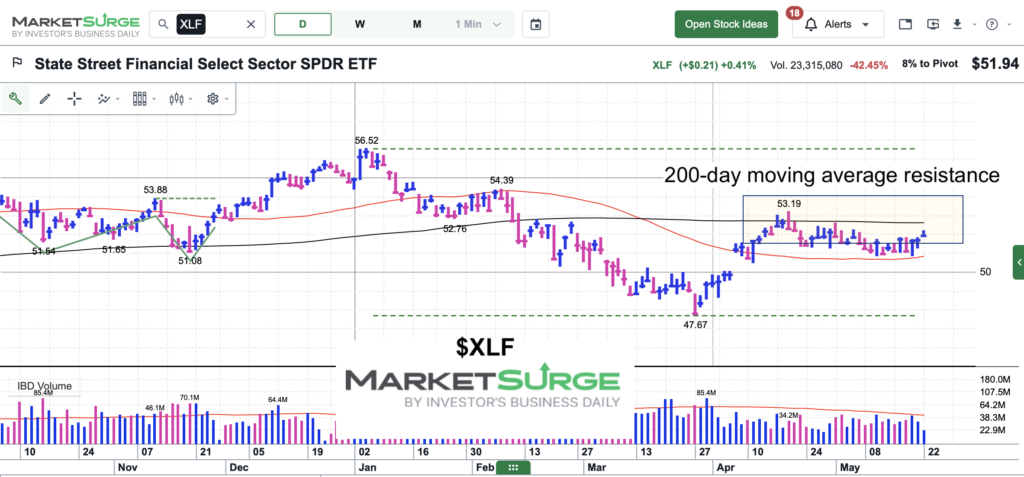
$XLF Financial Sector ETF Chart
As you can see, XLF is trading below its 200-day moving average (MA). This is a bearish indicator and should be watched in the day ahead, especially if the market begins to stutter. Ideally, bulls would love to see XLF take out the 200-day MA and continue higher. But until then, XLF is cautious/bearish.
Twitter: @andrewnyquist
The author may have a position in mentioned securities at the time of publication. Any opinions expressed herein are solely those of the author, and do not in any way represent the views or opinions of any other person or entity.
: Cup (and Maybe Handle) Watch")
 Trading Near Top Of Price Range")
 Reaches Important Price Support")