Nvidia is at the center of the semiconductor / AI movement.
And as AI creeps into the scene, it’s provided some added volatility as investors try to figure out what it means for big name tech stocks like Nvidia.
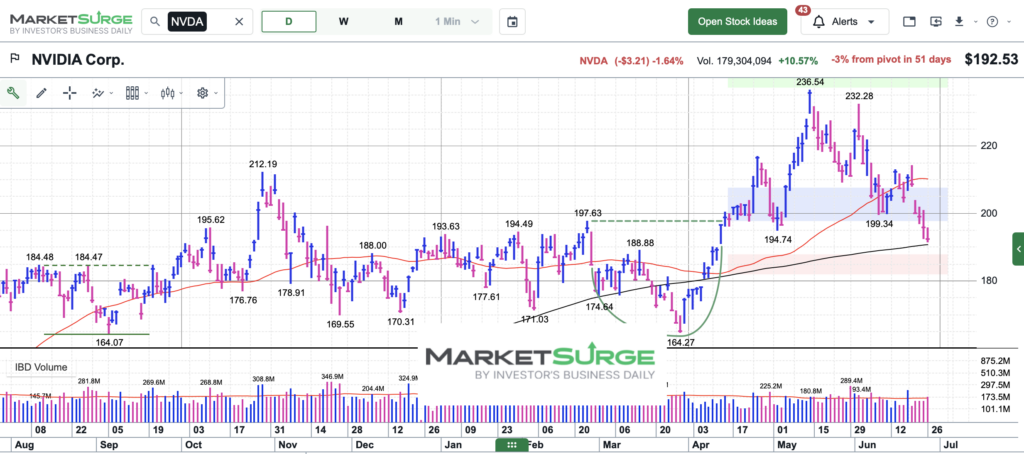
After a huge run to $200, Nvidia traded sideways between $165 and $200 for nearly 6 months before breaking out on a run up to $236. It then fell back to earth to test a critical price support level (the 200-day moving average).
Nvidia bulls want the 200-day MA to hold. If it doesn’t, it could fall back to the $165 level.
Note that the following MarketSurge charts are built with Investors Business Daily’s product suite.
I am an Investors Business Daily (IBD) partner and promote the use of their products. The entire platform offers a good mix of tools, education, and technical and fundamental data.
$NVDA Nvidia Stock Chart
Twitter: @andrewnyquist
The author may have a position in mentioned securities at the time of publication. Any opinions expressed herein are solely those of the author, and do not in any way represent the views or opinions of any other person or entity.