The decline in crude oil prices has been swift. For bullish traders, this has been painful… for consumers, this has provided relief at the gas pumps.
Today, we look at the Energy Sector ETF (XLE) and highlight why it’s next move will be telling for energy traders and quite possibly crude oil.
XLE bottomed two weeks ago, even though crude oil has continued to slide. XLE is now trading within an important price zone. What happens next will indicate if energy stocks still have bullish vs bearish intentions.
Note that the following MarketSmith charts are built with Investors Business Daily’s product suite.
I am an Investors Business Daily (IBD) partner and promote the use of their products. The entire platform offers a good mix of analysts, education, and technical and fundamental data.
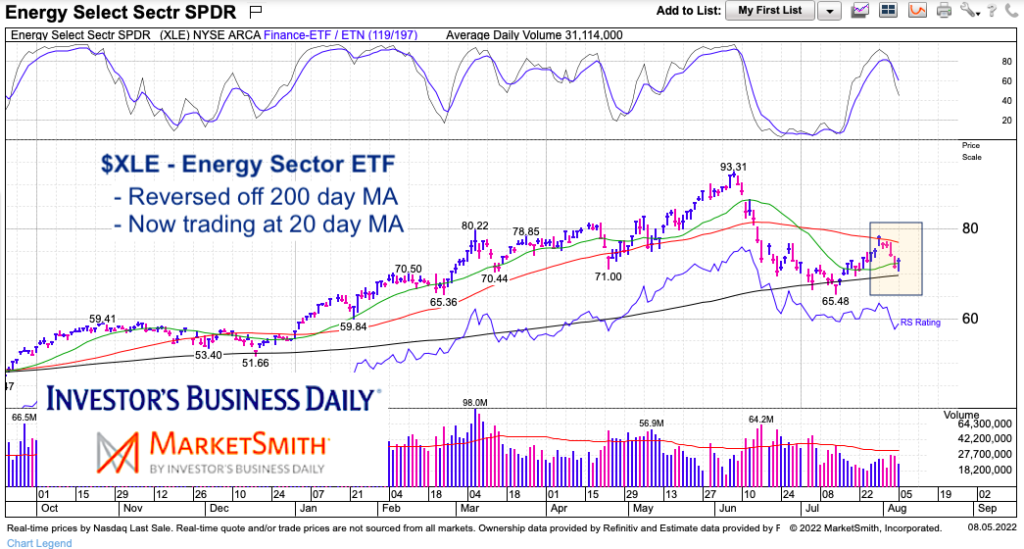
$XLE Energy Sector ETF “daily” Chart
The chart below highlights the past year of trading for the Energy Sector ETF (XLE). We can see the big rally, as well as the swift decline.
Short-term, we can see that price hit the 200-day moving average a couple weeks back and bounced from there. The bounce took XLE back up to its 50-day moving average, where it reversed lower again.
So we are currently stuck between the compression of these two moving averages. Currently, that is $70-$77 and compressing by the day. Note that the 20-day moving average is turning higher, but momentum is falling. Conflicting signals.
Bulls need to take out the 50-day moving average to confirm the next leg of this rally/bounce.
Twitter: @andrewnyquist
The author may have a position in mentioned securities at the time of publication. Any opinions expressed herein are solely those of the author, and do not in any way represent the views or opinions of any other person or entity.
Editor update august 11, 2022 3:43 pm CST. “200-day” was changed to 50-day” to correctly identify indicator in image.

: Worrisome to Broader Market?")

