Mish is at the Money Show, so I am filling in for two days till she returns, and I already managed to miss her Daily publishing deadline.
Sorry folks. I am posting this late or early now, but all of you are included, and all of you have time to take advantage of the macroeconomic backdrop unfolding that Mish is discussing today at the Money Show- andover the next several weeks.
The fourth quarter is traditionally a bullish seasonal trading pattern, but this quarter could see declines, or a divergence might continue emerging.
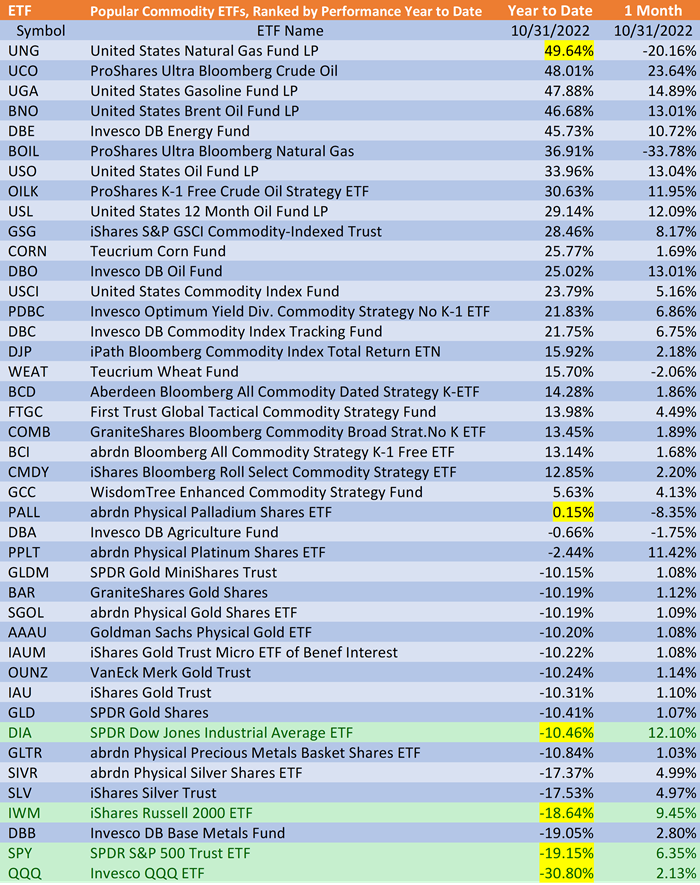
Popular commodity ETFs listed in descending order by year-to-date performance to 10-31-2022. For comparison, IWM, SPY, QQQ, and DIA performance highlighted. PALL ETF is the last ETF positive year-to-date. Please note that multiple commodity ETFs above had double-digit gains last week and do not use leverage.
The SPY ETF is in a trading range of 380 to 395, yet small-caps (IWM, AKA Gramps) and the Dow Jones (DIA) are pulling away.
Commodity ETFs provide exposure to metals, energy, grains, cattle, coffee, and sugar, as well as diversification away from the market and potentially high profits.
Commodities historically are also a powerful hedge against inflation, so buying before periods of sustained inflation is wise.
However, trading specific commodity spikes can be challenging, and drawdowns brutal.
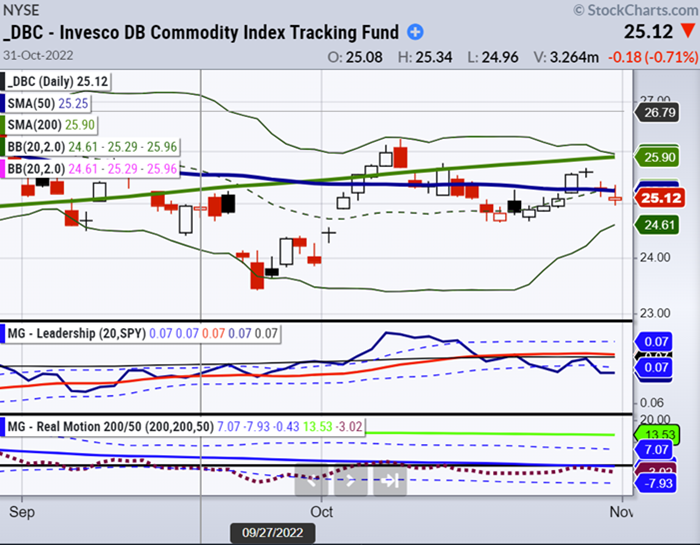
The Invesco Deutsche Bank Commodity ETF has closed below its 50-day
moving average on 10-31-22 after struggling and regaining it briefly.
DBC’s price fluctuations on Monday aptly captured the mood of uncertainty and price volatility which will probably continue in stocks, bonds, and commodities with eyes on the Fed.
Looking at DBC, it can reclaim its 50-day moving average and eventually its 200-day moving average, but DBC could quickly decline in the short term since the price is below the 27.05 resistance level. There is also strong support which rests lower at 23.50.
Our proprietary indicators, such as our Real Motion Indicator and TriplePlay Indicator, signal high-probability impulse momentum-driven price moves. They help signal and alert traders where and when capital should be deployed and into which commodities.
We tend to trade individual commodities, precious and industrial metals, energy like crude oil, natural gas, unleaded gasoline, and soft commodities grown or ranched – such as sugar, corn, wheat, and soybeans.
Stock Market ETFs Trading Analysis & Summary:
S&P 500 (SPY) Sold off into previous support (386) with 380 now support and 395 resistance level to watch.
Russell 2000 (IWM) 181 still support and 186 same resistance
Dow (DIA) 324 support and 330 resistance
Nasdaq (QQQ) Sold off into previous support (277) with support now at 275 with 281 resistance
KRE (Regional Banks) 62 support and 65 resistance level; same as before
SMH (Semiconductors) 186 support and 193 resistance
IYT (Transportation) 208 support and 214 resistance; same as before
IBB (Biotechnology) 127 support and 132 first resistance; same as before
XRT (Retail) 61 support and 65 resistance; same as before
Twitter: @marketminute
The author may have a position in mentioned securities at the time of publication. Any opinions expressed herein are solely those of the author and do not represent the views or opinions of any other person or entity.


