Consumers have taken notice to falling gas prices… and they like it.
But will gas prices continue to fall? For that to happen, consumers (and investors) will need to pay close attention to crude oil prices (which have been falling lately)… And they should be aware a very bearish potential chart pattern…
Well, it’s Friday. So let’s turn to Joe Friday for “The facts, Ma’am. Just the Facts.”
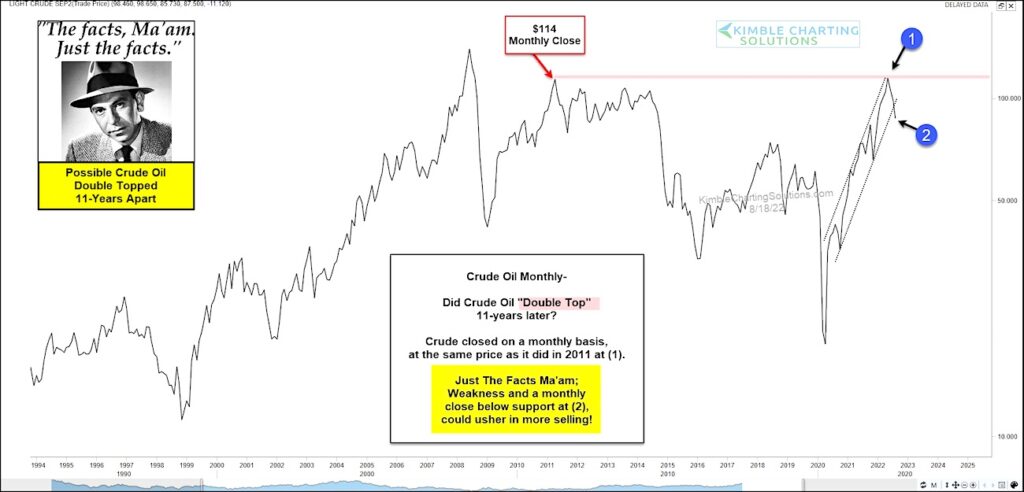
Below is a long-term “monthly” line chart of crude oil that highlights the prospects of a potential double top pattern at point (1). As you can see, crude oil closed on a monthly basis at the same price it did 11 years ago (red arrow and line). And now it is reversing lower.
This move lower has also taken the price of crude oil below its uptrend support line at (2). If it closes the month below this trend line, it would be concerning.
This brings an interesting (and important) question to light: Did the most important commodity on the planet double top 11-years later? Stay tuned!
Crude Oil “monthly” Chart
Note that KimbleCharting is offering a 2 week Free trial to See It Market readers. Just send me an email to services@kimblechartingsolutions.com for details to get set up.
Twitter: @KimbleCharting
Any opinions expressed herein are solely those of the author, and do not in any way represent the views or opinions of any other person or entity.


