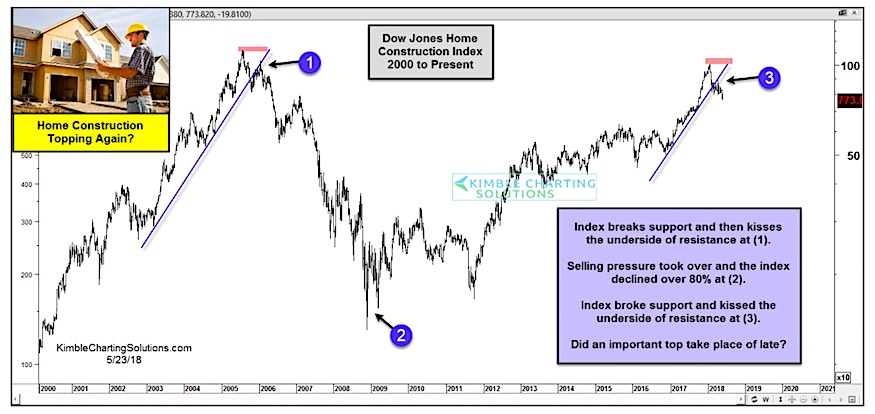
Dow Jones Home Construction Index: Trouble Is Brewing
After topping in January 2018, the stock market has become a bumpy ride.
We endured a correction on most major stock indexes and are now...
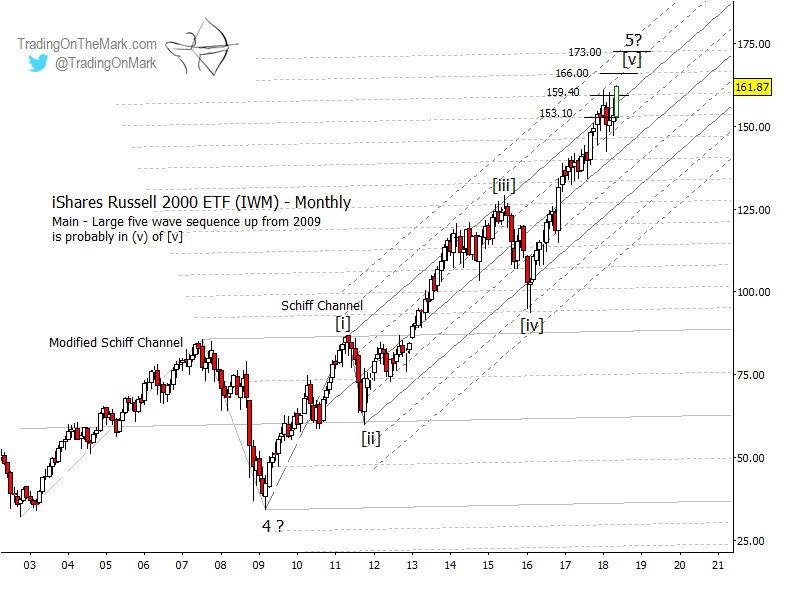
Russell 2000: Bulls Charging Toward Next Elliott Wave Targets
We wrote at the end of March that we believed the correction in equities was almost over and that the Russell 2000 Index in...
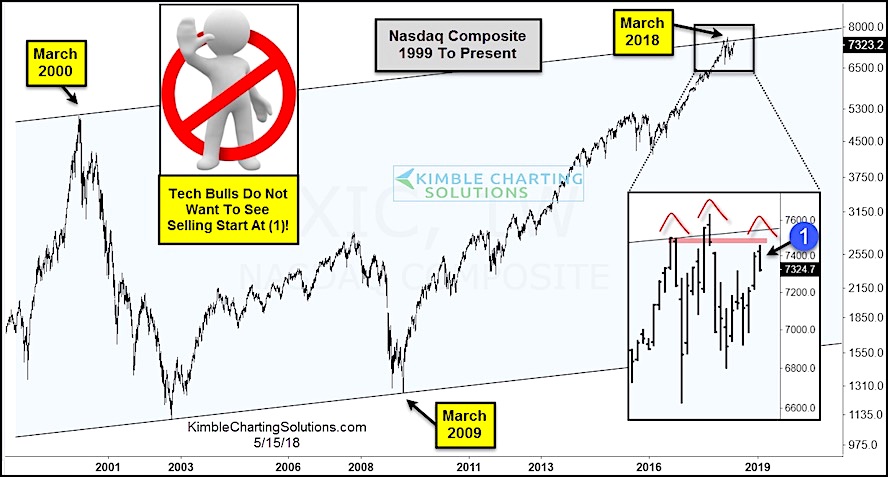
March Turning Point? Tech Bulls Don’t Want To See Selling Here!
Tech stocks have been the life blood of the bull market, especially the run higher over the last 2 years.
But the recent selloff has...
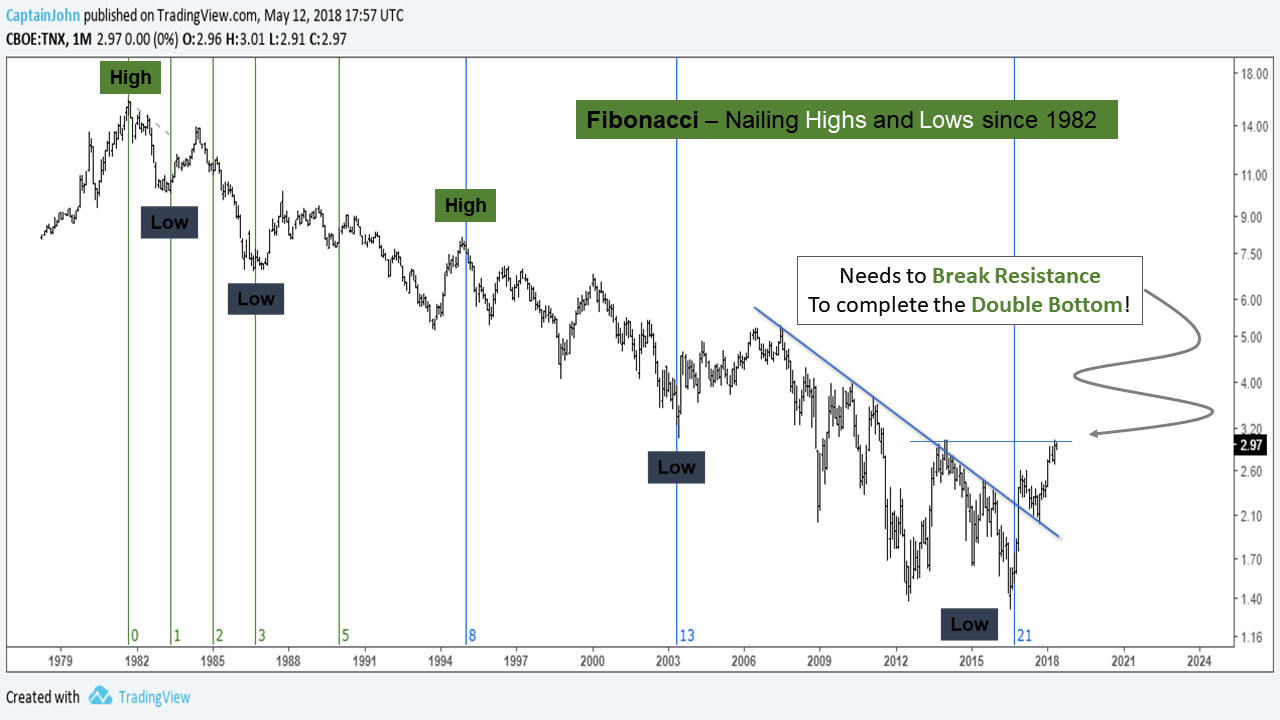
10 Year Treasury Yield Long-Term Outlook: Charts Point Higher
The 10 Year US Treasury Yield is getting the attention of investors here around 3 percent.
Well, it looks to be headed higher yet in...
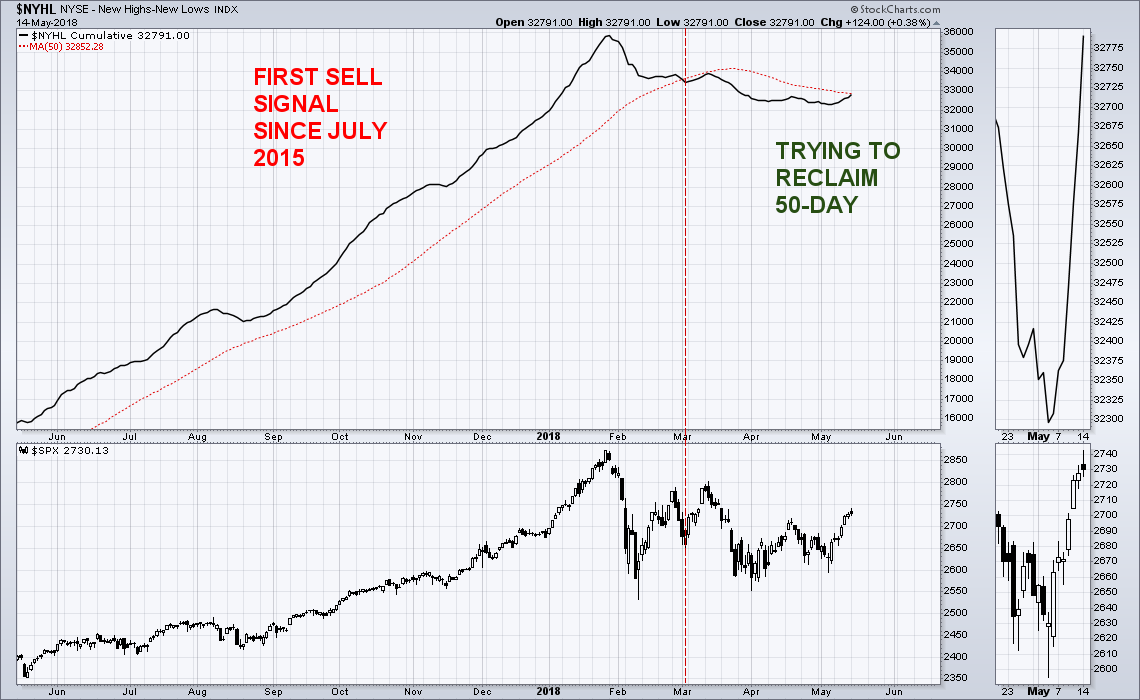
Stock Market Update: Bullish Breakouts Await Follow Through
The major indices all broke out of basing patterns (triangles) with the Russell 2000 (RUT) Small caps finishing last week at a new all...
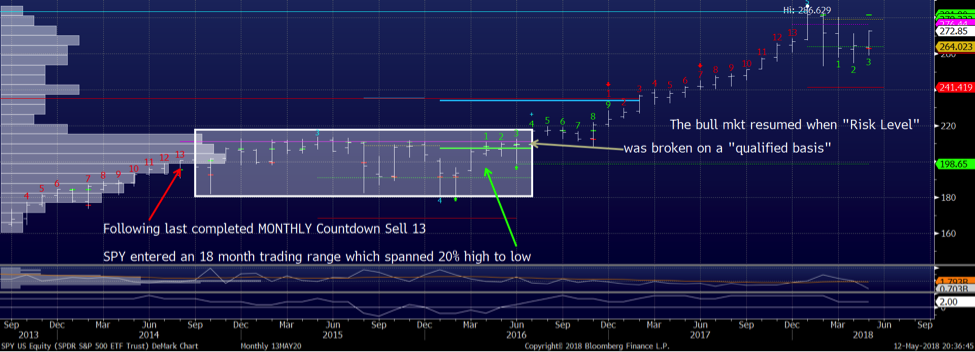
Stock Market Update With DeMark Indicators: More Sideways Ahead?
For much of 2018, the stock market has been trading sideways with a high degree of volatility. This in part due to the ongoing...
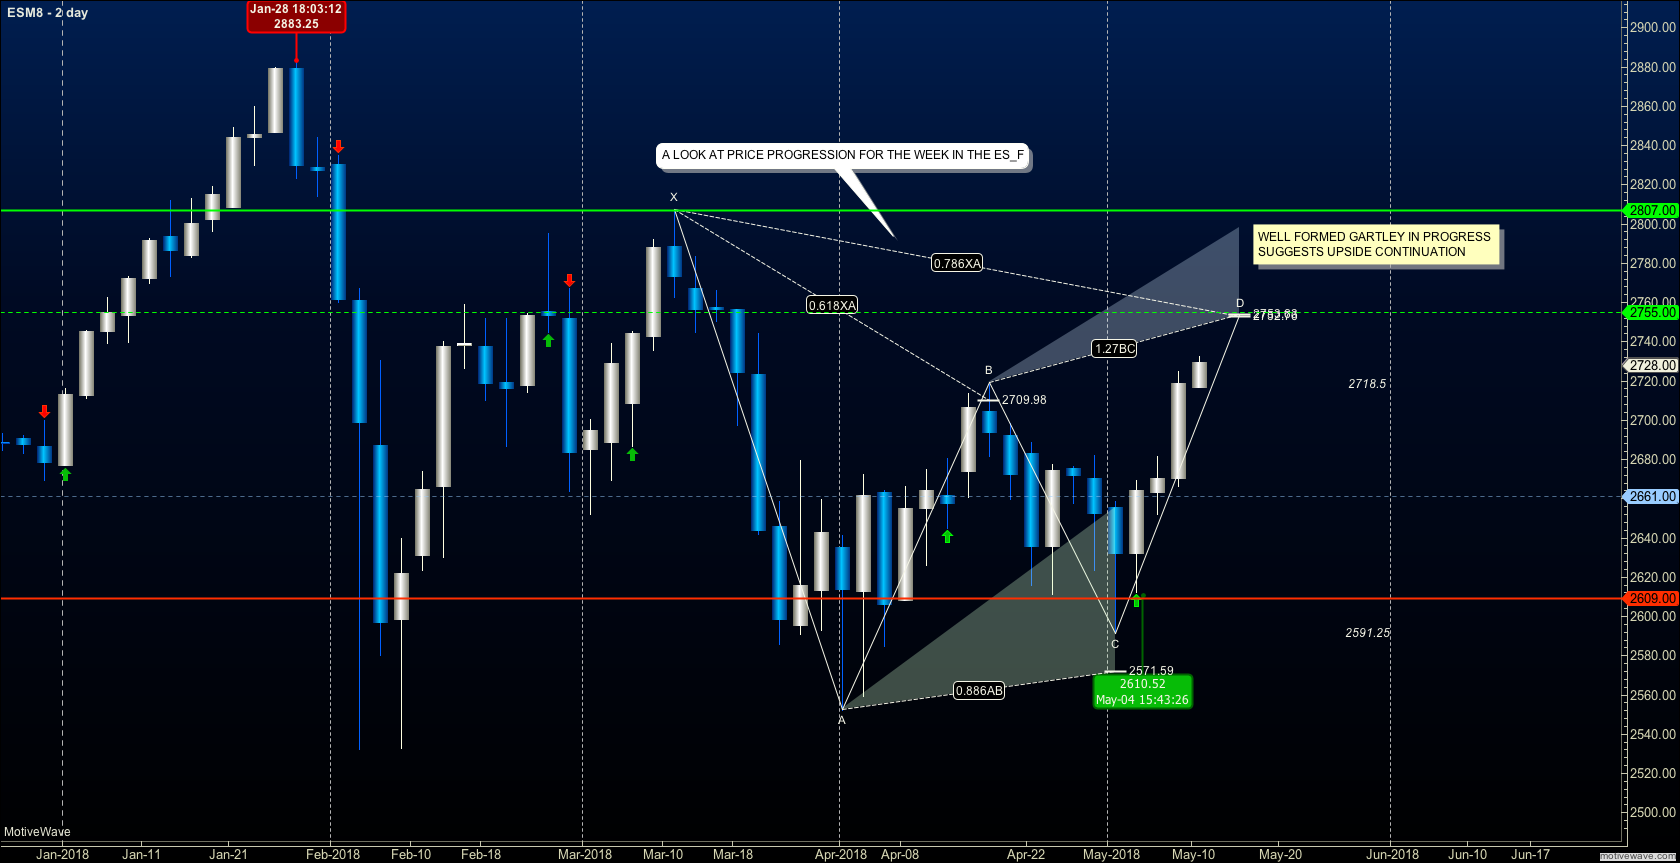
S&P 500 Bullish Gartley Pattern Points To Higher Targets
The S&P 500 looks poised to head higher yet this week.
And that looks due in part to a well formed bullish Gartley pattern. A-B-C-D
The...
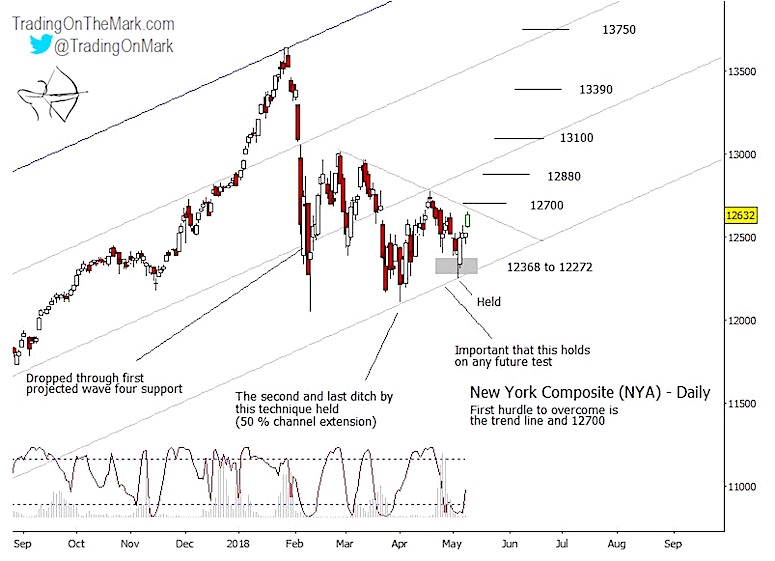
NYSE Composite Index Ready To Head Higher
A little over a month ago, we posted a chart and analysis showing that a popular Russell 2000 ETF (NYSE Arca: IWM) might be...
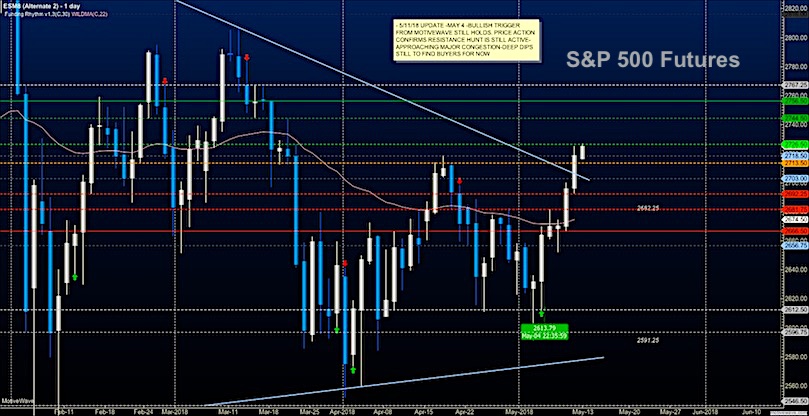
S&P 500 Futures Update (May 11): Into Price Congestion
Broad Stock Market Futures Outlook for May 11, 2018
Though I have seen upward motion continue past 7 days, it is not the rule of...
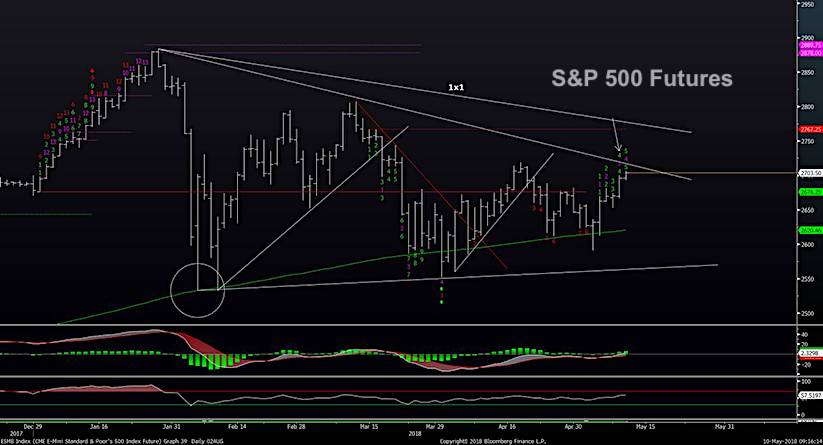
S&P 500 Trading Outlook: Bulls Testing Key 2720 Level
S&P 500 futures have extended over 2700, targeting the first meaningful price level near 2718/2720.
This equates to the slope of the line from the January...

