Tech stocks have been the life blood of the bull market, especially the run higher over the last 2 years.
But the recent selloff has caught investors attention.
The bulls hope that the selling is morphing into consolidation… that will eventually breakout to the upside.
But for now, the bears still have an opportunity.
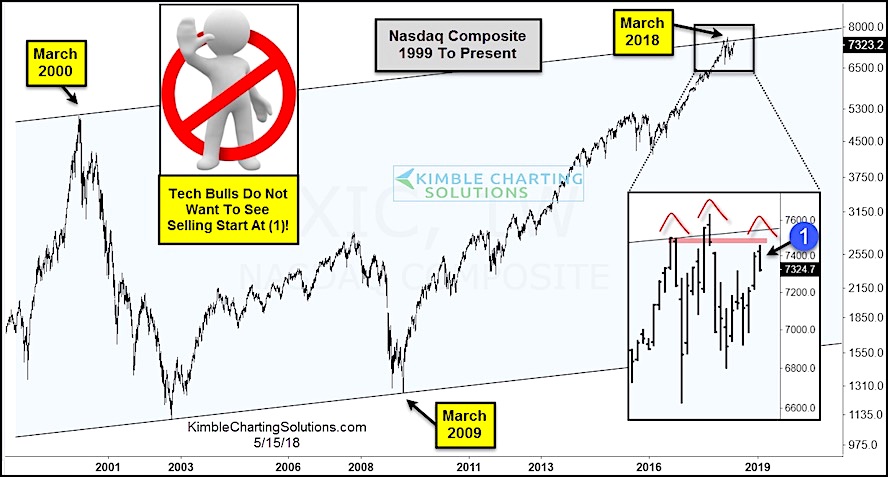
In the chart below, you can see that March has been a month of major turning points (March 2000 high, March 2009 lows, and TBD March 2018).
In the zoomed-in box below, you can see that the recent correction and choppy price action has formed a potentially bearish pattern: a head and shoulders top. The right shoulder is “under construction”, so bulls don’t want to see heavy selling here.
Will the Ides of March prove to be a “turning point” again? Keep an eye on this chart pattern.
Nasdaq Composite – 1999 to 2018
Note that KimbleCharting is offering a 30 day Free trial to See It Market readers. Just send me an email to services@kimblechartingsolutions.com for details to get set up.
Twitter: @KimbleCharting
Any opinions expressed herein are solely those of the author, and do not in any way represent the views or opinions of any other person or entity.
: Showing Some Signs of Emerging Strength")


: Showing Some Signs of Emerging Strength")