A little over a month ago, we posted a chart and analysis showing that a popular Russell 2000 ETF (NYSE Arca: IWM) might be near the completion of a fourth-wave correction.
We suggested it was on the verge of making a higher low versus that of February and that it should rise thereafter. So far that forecast has worked very well.
Now we show what a breakout might look like on a faster time frame using a daily chart of the broad NYSE Composite Index. There’s a key price resistance level nearby that must be overcome.
The overall form of the correction in most of the major U.S. stock market indices has been a converging range.
Often the final major correction — the fourth wave in a five-wave Elliott wave impulsive sequence — takes on a converging, time-consuming shape. Strictly the pattern might not be an Elliott wave triangle, as the large initial downward move did not consist of three obviously distinct sub-waves.
The NYSE Composite (NYA) pattern showed an additional characteristic of fourth waves in that it found support at an important harmonic price point of the guiding channel.
NYSE Composite Index (NYA) Elliott Wave Chart
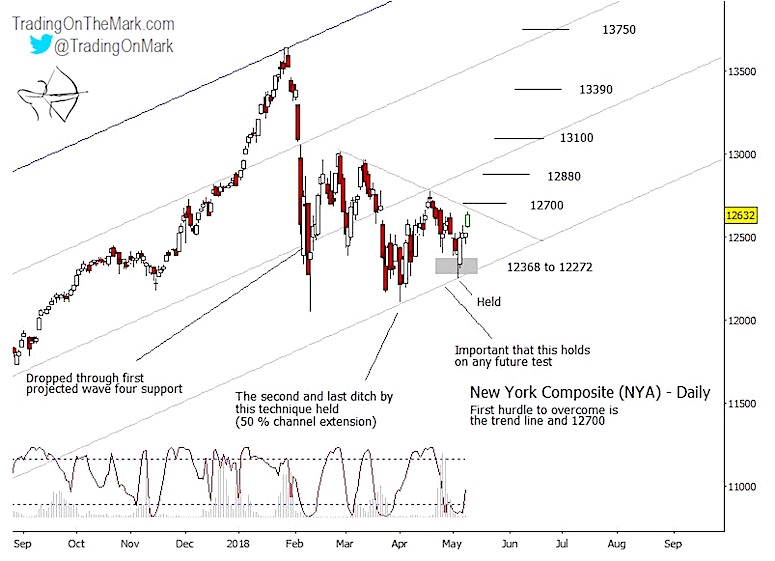
With the channel harmonic twice tested as support, it would be favorable for the bullish forecast if the line were not tested again. A break and daily close beneath the supporting line would suggest that the correction might become larger and require substantially more time to resolve.
The strong rally after the higher test of support is a bullish signal. Initial confirmation that price truly is rising out of the correction would come with a breach and daily close above the trend line resistance shown. A break above the level of the April 18 high of 12774 would serve as even better confirmation.
Using a proprietary method, our preliminary targets for the internal moves of this fifth wave (of an initial move higher) are shown on the chart at 12700, 12880, 13100, 13390 and 13750. We will be able to refine the targets as the next segment of the pattern develops. Eventually the move should take the index to a new high later in 2018 or early 2019.
With a subscription at Trading On The Mark you’ll get daily chart updates with this type of analysis for a variety of markets including the S&P 500, crude oil, gold, the Euro, the Dollar, and bond futures. There’s an option for intraday trading support too!
Twitter: @TradingOnMark
No position in any of the mentioned securities at the time of publication. Any opinions expressed herein are solely those of the author, and do not in any way represent the views or opinions of any other person or entity.

 Rolling Over At Key Fibonacci Level?")


 Rolling Over At Key Fibonacci Level?")