For much of 2018, the stock market has been trading sideways with a high degree of volatility. This in part due to the ongoing correction / consolidation.
So, where are we now?
From a DeMark indicators standpoint, the primary posture of the secular bull market which began in 2009 hit a “buy exhaustion” phase in December of 2017 when the SPY printed a monthly TD Countdown Sell 13.
The last time this happened, the SPY consolidated for more than 18 months within a 20% range.
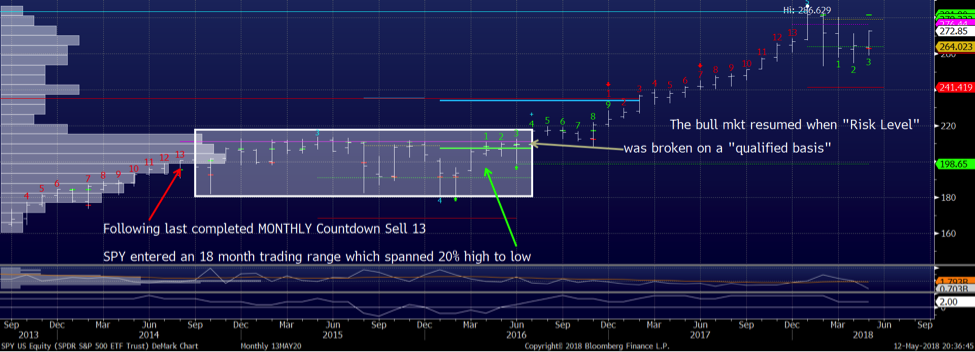
In my opinion the same behavior is repeating itself now, and this will remain true until either a) the “Risk Level” (dotted purple line at $276.44) is broken on a qualified basis, or b) a “monthly” TD Buy Setup – a green 9 count (currently on bar 3) completes.
In this context, the market can have many shorter-term violent gyrations in both directions.
On the “weekly” chart for example, you can see that a Countdown Sell 13 also printed, this one on March 9, 2018. It happened after the SPY already had a sharp drop in early February, and served as precursor to a retest of the lows in early April.
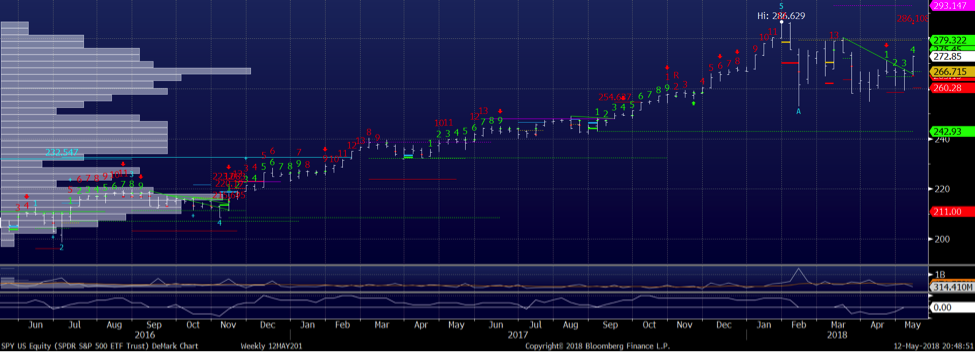
On this shorter time frame, bulls can rally around a couple of signals: a weekly TD Sell Setup (on bar 4) is holding, and there’s a qualified TD Line break which targets $286.10. However, until and unless there’s a QUALIFIED break of the MONTHLY Risk Level, even reaching the $286.10 target appearing on the weekly chart would not – in my opinion – signal a resumption of the primary bull market. Of course, given that the weekly TD Line target is above the monthly Risk Level, the chances that the latter would break on a qualified basis increase.
Net-net, for now I would describe the weekly counts as neutral to bullish in the context of the broader monthly buy exhaustion signal.
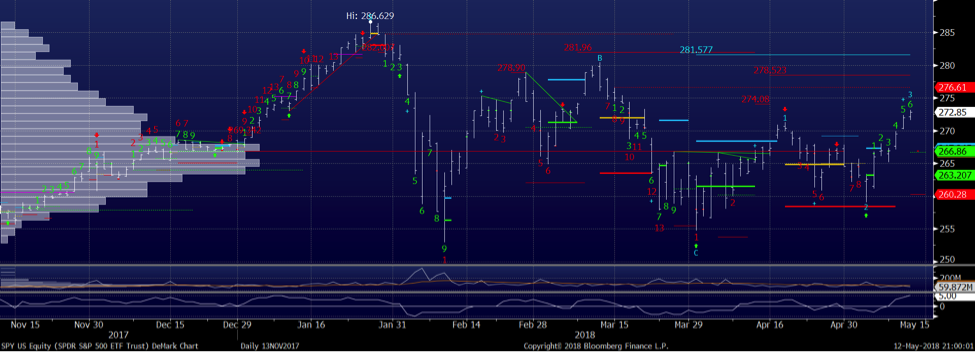
The “daily” timeframe is generally too short for my style, but that too looks neutral to bullish with $276.61 (daily TDST Level Up) an important level for bears to protect. Bears would also want to see the TD Sell Setup count (currently on bar 6) cancel before completion.
The setups for the QQQ is fairly similar to that of the SPY, though the Q’s have more room to the upside before monthly Risk Level at $186.14 is in danger of breaking on a qualified basis. The IWM still has several monthly bars to go before completing a Countdown Sell 13 (currently on bar 7), but that could happen as a function of time and without too much more price upside (this has to do with the “reference bar 8” in the Countdown Sell computation, something that requires too much explanation to deal with in this article).
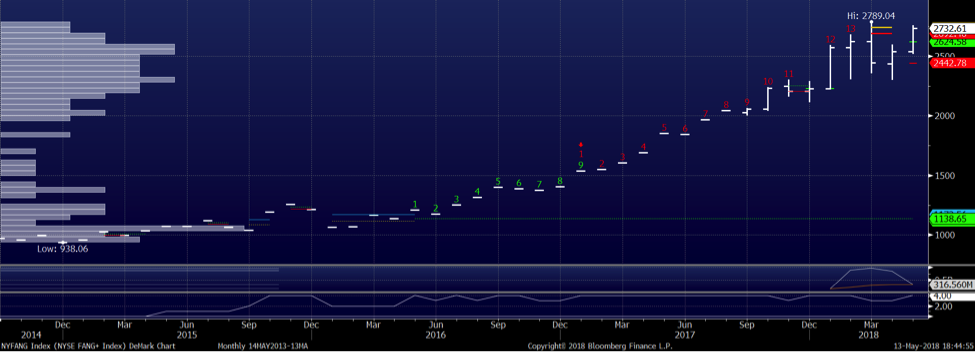
Given the rabid interest in Facebook (FB), Amazon (AMZN), Apple (AAPL), Netflix (NFLX) and Google (GOOGL), here is a look at the NYSE FANG+ Index which aggregates the five tech giants.
The index sits at $2732. The monthly chart printed a Countdown Sell 13 in February with the associated Risk Level at $3058. The same buy exhaustion analysis flagged on the SPY chart applies here.
The weekly chart is also nearly identical to the weekly SPY chart. The recent Countdown Sell 13 shows Risk Level at $2869 and has a qualified TD Line target at $2893. The active TD Sell Setup is on bar 4.
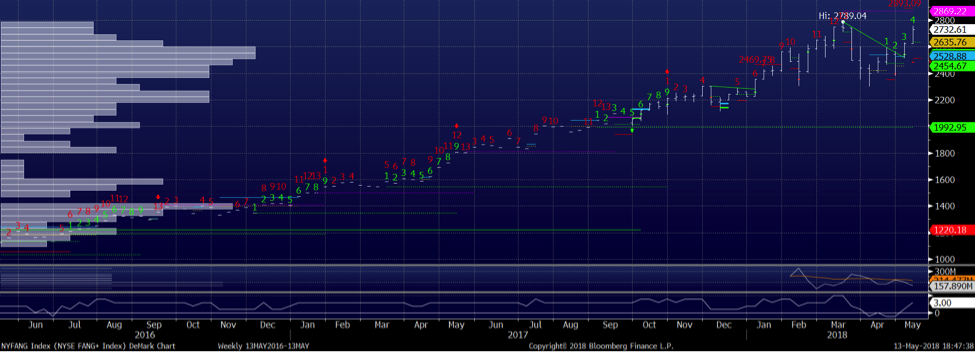
The daily chart is the most bullish of the three time frames with a completed TD Sell Setup, and price just below TDST Level Up at $2763. The TD Sell Setup now calls for a Countdown Sell 13 to go to completion (currently on bar 3), and a qualified break of TDST Level Up would change the daily trend back to bullish. Again, for my taste, I am much more focused on the weekly and monthly charts, although I appreciate that these are the ultimate mo-mo names, which naturally attract the shorter term players.
In sum three observations: first, I continue to think the market will trend mostly sideways for several months, with sharp up and down moves signifying little. Second, if I am wrong and the market is set to ramp right-here / right-now, the levels discussed above will be my tells and should prevent me from missing out too much. I just don’t feel the urge to chase / anticipate that move right now.
Lastly, technical analysis only shows one side of what is happening to the markets. In my view corporate credit remains THE key driver for equities, and any change – to the good or bad – can shift the prospects for stocks in a hurry. I won’t discuss credit in this piece other than by saying that, unsurprisingly, many of the measures in that market seem consistent with the conclusions I am drawing from the above charts.
Thanks for reading and good trading!
Twitter: @FZucchi
The author has positions in the following mentioned securities: SPY, QQQ, IWM, AAPL, and FB. Any opinions expressed herein are solely those of the author, and do not in any way represent the views or opinions of any other person or entity.


