We wrote at the end of March that we believed the correction in equities was almost over and that the Russell 2000 Index in particular was getting ready to push to a new high.
It achieved that new high a bit more quickly than we expected, but the rally should still have farther to go.
It is testing the first resistance zone now.
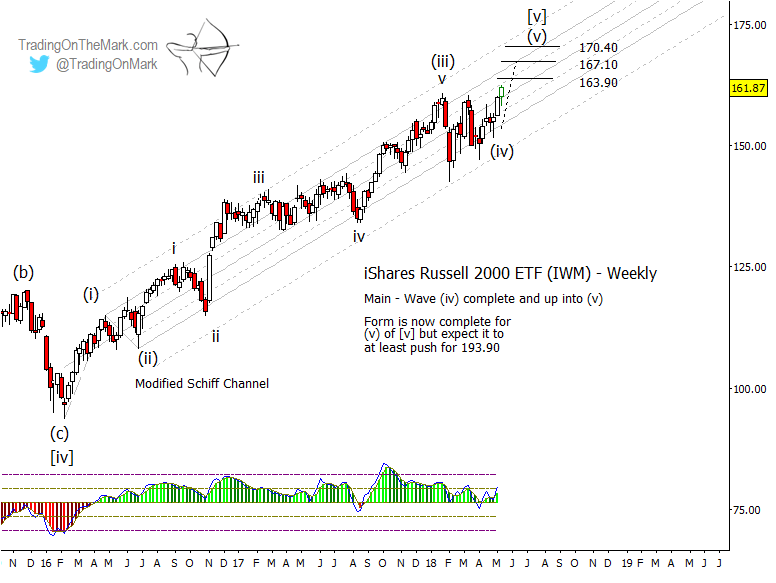
Here we show some updated Russell 2000 price targets looking specifically at the ETF that best tracks the index — the iShares Russell 2000 ETF (NYSEArca: IWM). Since the rally is already underway, it makes sense first to monitor nearby resistance areas where a trader might lock in profits or otherwise manage the trade. Based on Gann methods, nearby overhead targets for IWM emerging from Elliott wave (iv) on a weekly chart show up at 163.90, 167.10 and 170.40.
We do not yet know what form upward wave (v) of [v] is taking. It could turn into a non-overlapping impulsive wave, but it may be more realistic to expect the lower volatility of summer trading to constrain future rallies and produce an overlapping ending-diagonal pattern.
It is even possible that wave (v) may be complete, as it has met the minimum formal requirement. In coming weeks and months, we will watch for momentum divergences and other indications of completed structures on smaller time frames in IWM and also the S&P 500 Index, which we follow closely for subscribers.
$IWM Russell 2000 Price Targets – Weekly Chart
Stepping back to a monthly time frame, the next chart shows two channels that have been influential for IWM. The larger, older one (the modified Schiff channel) is anchored at the lows and the high of the prior decade. Throughout the present decade, IWM has recognized the rising 1/8th harmonics of that channel fairly well, so traders should pay attention to the next harmonic levels near 159.40, 166.00 and 173.00.
$IWM Russell 2000 Price Targets – Monthly Chart
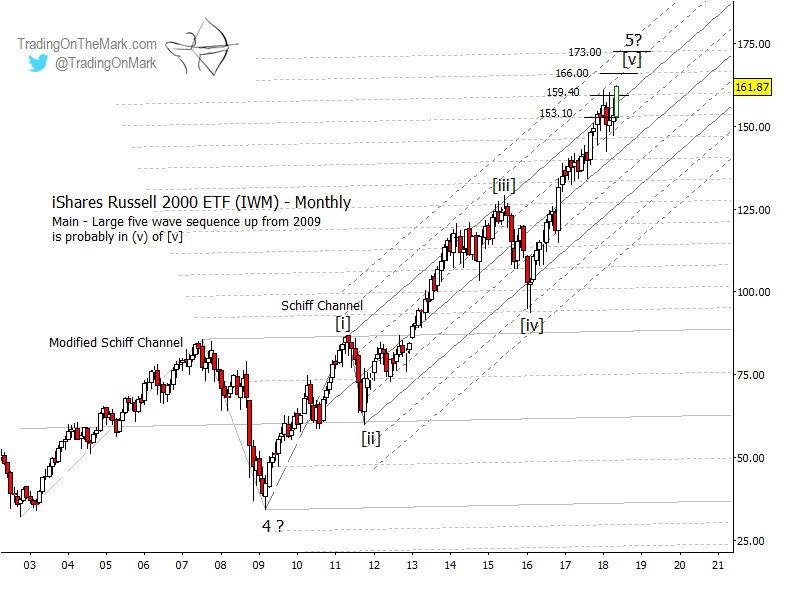
The steeper Schiff channel has guided price up from the 2009 low, which we are treating as a very large wave ‘4’, and upward toward the completion of very large wave ‘5’. It’s worth noting that the areas where the harmonic lines of the two channels intersect have sometimes produced consolidation or reversals.
Trading is easier when you let TOTM’s weekly, daily and intraday technical analysis highlight areas to watch for reversals and continuation. Our daily updates typically include the S&P 500, crude oil, gold, the Euro, the Dollar, and bond futures. Check out our website and follow us on Twitter.
Twitter: @TradingOnMark
The authors may have a position in the mentioned securities at the time of publication. Any opinions expressed herein are solely those of the author, and do not in any way represent the views or opinions of any other person or entity.


