The major indices all broke out of basing patterns (triangles) with the Russell 2000 (RUT) Small caps finishing last week at a new all time closing high and the NASDAQ 100 (QQQ) only 2.4% away from a closing all time high.
The S&P 500 busted out of its major triangle that started over three months ago, signaling the possibility that the index could be starting another major wave higher.
The next key hurdle could be the March high up at 2,802.
Within the second part of the triangle, starting with the early April low, it looks like the “500” traced out a bullish ABC formation. This is similar to a double bottom except the second low remains above the first low. A measured move based on this pattern targets the 2,802 to 2,860 area. Based on the size of the entire triangle, the “500” could see a measured move up to or above the 3,000 zone.
S&P 500 Chart
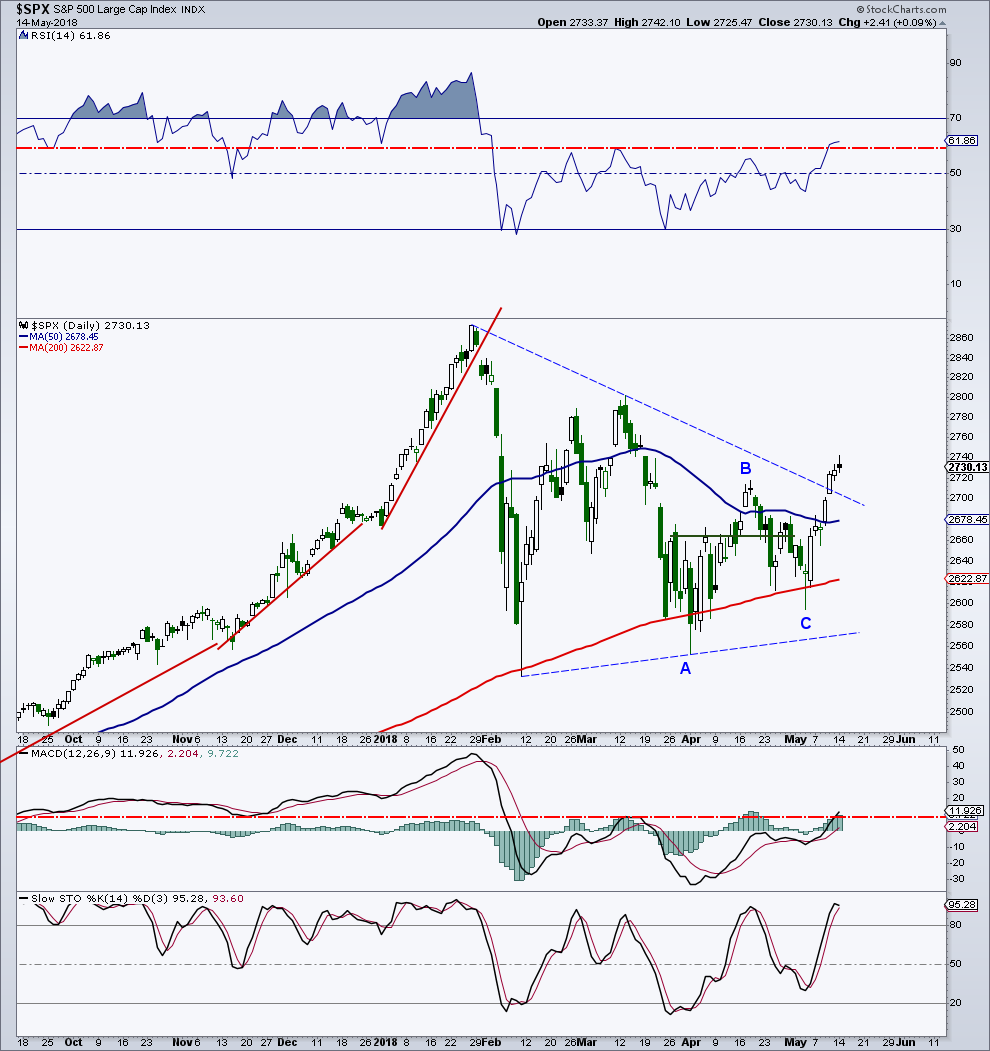
Besides the impressive price breakout and consistency of the price gains since the May 3 low, there has also been a nice improvement in momentum as well as market breadth. The 14-day relative strength index (RSI) of the “500” is back above 50, a positive. In addition, the 14D RSI also broke out of its range going back to February to a new high, another bullish sign.
The daily MACD is back in positive territory, close to breaking out of a bullish inverse head-and-shoulders formation.
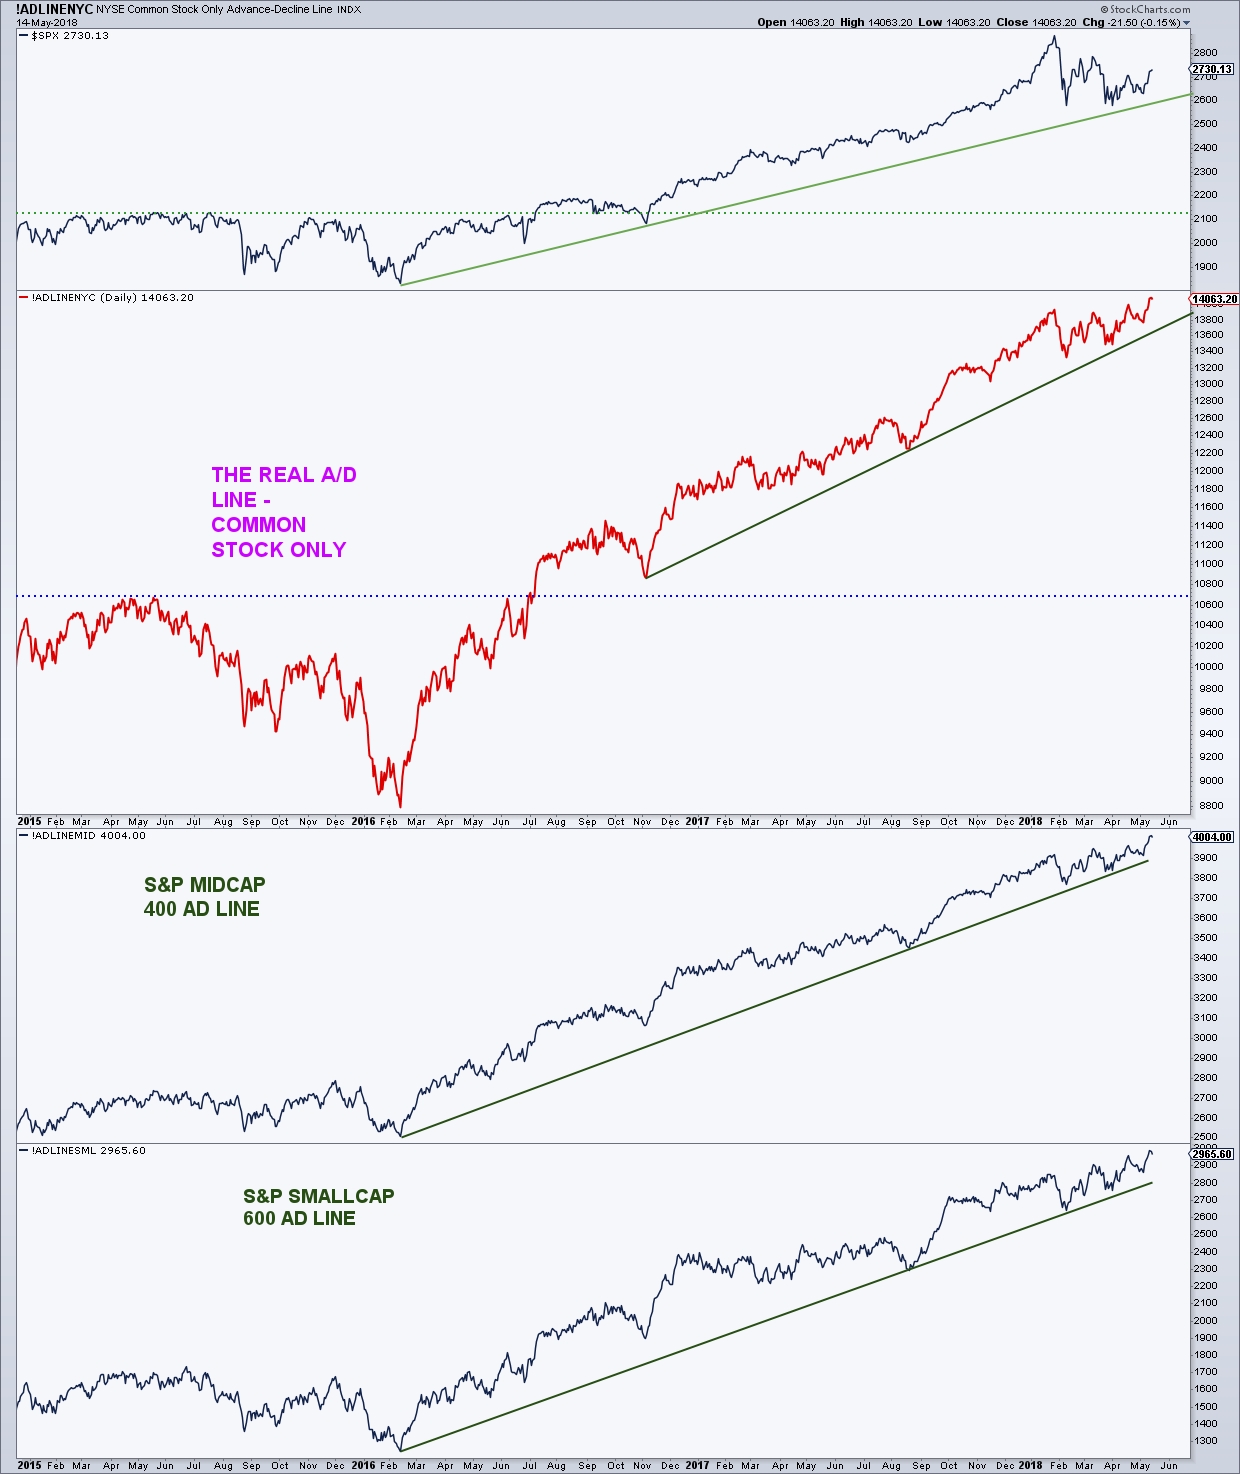
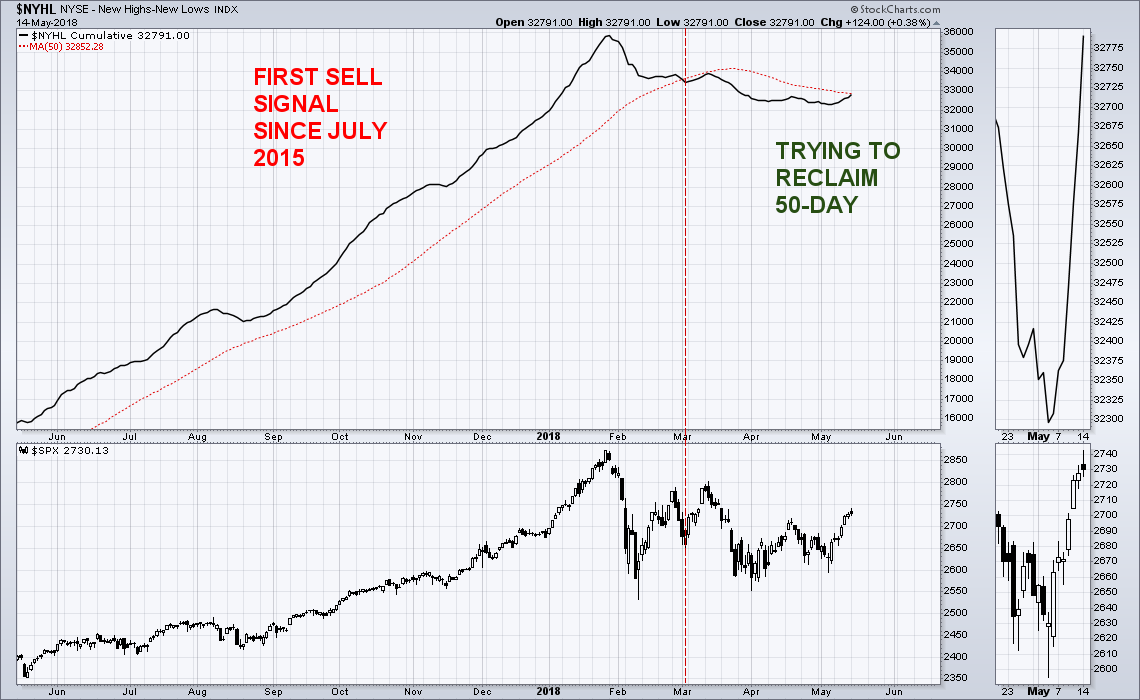
The simplest measure of market breadth, the advance/decline (AD) lines of the NYSE common-only stocks, the S&P 400 Mid Caps, and the S&P 600 Small Caps all remained bullish throughout the entire pullback. Last week they bullishly all broke out to all time highs. The AD line of NYSE New Highs minus New Lows, which broke below its 50-day average in the beginning of March, and something we have been worried about, is close to bullishly reclaiming this key average.
Market Breadth Charts
Feel free to reach out to me at arbetermark@gmail.com for inquiries about my newsletter “On The Mark”. Thanks for reading.
Twitter: @MarkArbeter
The author may have a position in mentioned securities at the time of publication. Any opinions expressed herein are solely those of the author, and do not in any way represent the views or opinions of any other person or entity.

: Cup (and Maybe Handle) Watch")
 Trading Near Top Of Price Range")

