Tag: technical analysis
Technical Update: Stock Indices Remain Bullish
The uptrends in the major U.S. stock market indices remain firmly intact.
The recent pullback in the S&P 500 Index and Nasdaq Composite held at...
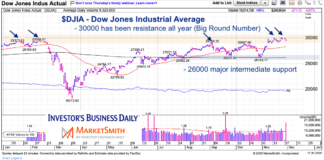
Dow Jones Industrials 30,000 and the Big Round Number Psychology
Just as the Dow Jones Industrial Average was nearing 30000 earlier this year, coronavirus hit and the markets crashed. From there a remarkable recovery...
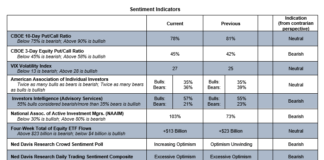
U.S. Equities Technical Outlook: Indicators Mixed But Improving As Election Nears
This article is the second of two research pieces that provide an updated outlook for the U.S. stock market. This research piece looks at...
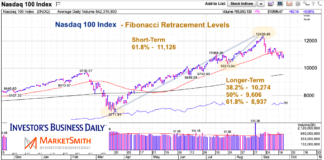
Nasdaq 100 Correction: Short and Long Term Fibonacci Retracement Levels
The sharp decline in tech stocks has run deeper than the broader markets and is now well into correction territory.
Looks like a case of...
Stock Market Today: Growth Stocks Come Storming Back
The stock market continues to push higher after blowout earnings from FAANG stocks.
Technology and growth stocks are carrying the major stock indices higher yet...
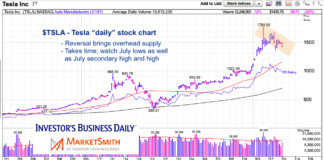
Tesla Stock Update: Reversal Highlights Time / Price Relationship
Tesla's stock (TSLA) continues to capture the imagination of investors.
TSLA has a long history of being a heavily shorted (and doubted) stock, mostly due...
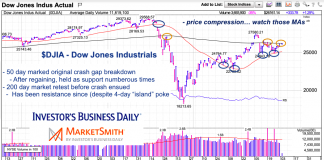
Dow Jones Industrials: Moving Averages Ping-Pong Into Price Compression
Investing isn't easy. News, data, and the resulting bias can form opinions that often times leads to under-performance.
But, as most veteran traders say, price...
Bearish Divergences Abound in Nasdaq 100 Index
Today’s chart is the Nasdaq 100 index, and the focus is on bearish divergences.
The Nasdaq 100 chart doesn’t just show the Nasdaq 100, it...
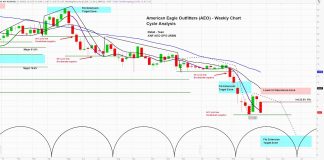
American Eagle (AEO) Looks to Increase Liquidity, But Cycles Bearish for...
American Eagle Outfitters NYSE: AEO announced a number of new actions as the company manages through the COVID-19 / coronavirus crisis.
American Eagle (AEO) suspended...
S&P 500 Index Reaches Above Monthly SD Bollinger Band
The S&P 500 "monthly" chart shows the extent of how far this year's 25 percent rally has come.
And what it may mean for stocks...


