Investing isn’t easy. News, data, and the resulting bias can form opinions that often times leads to under-performance.
But, as most veteran traders say, price is always king.
Follow price and you’ll find be able to stay in-trend for longer (time frame dependent).
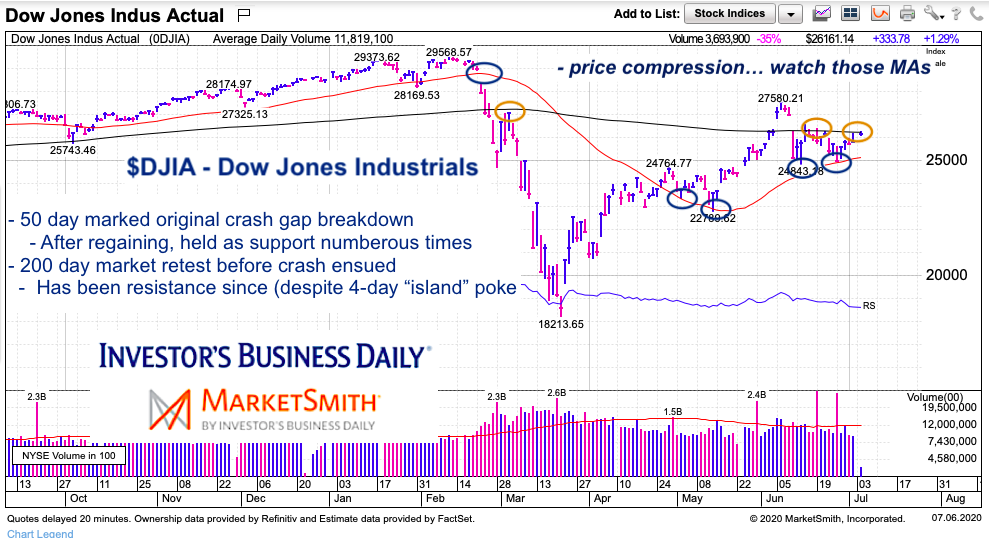
In today’s chart image, we look at the importance of two price based trend indicators: the 50-day and 200-day moving averages. And specifically for navigating the Dow Jones Industrial Average.
Note that the following MarketSmith charts are built with Investors Business Daily’s product suite.
I am an Investors Business Daily (IBD) partner and promote the use of their products. The entire platform offers a good mix of technical and fundamental data and education.
Dow Jones Industrial Average “daily” Chart
In uncanny fashion, the 50 and 200 day moving averages have shown great trend insights (of course, hind sight is easy!). BUT just look. When the 50-day moving average broke down in late February, it lead to a mini-crash of sorts. Then price retested the underside of the 200 day MA before failing and crashing.
Next came the recovery… after re-taking the 50-day MA, price retested it several times as support. Note as well that despite a 4-day poke over the 200-day MA (and resulting “island”), the 200 day has held as resistance.
Now price is compressing and a bigger move is coming. Stay tuned.
Twitter: @andrewnyquist
The author may have a position in mentioned securities at the time of publication. Any opinions expressed herein are solely those of the author, and do not in any way represent the views or opinions of any other person or entity.


