This article is the second of two research pieces that provide an updated outlook for the U.S. stock market. This research piece looks at the market from a technical perspective, while the prior piece examines the market from a fundamental perspective.
I break out each of the key technical variables into separate research discussions with individual investment grades. To recap, the tailwinds include strong broad market participation while the headwinds include excessive investor optimism and complacency. This likely means near-term volatility, as the current cyclical stock market rally continues to run its course.
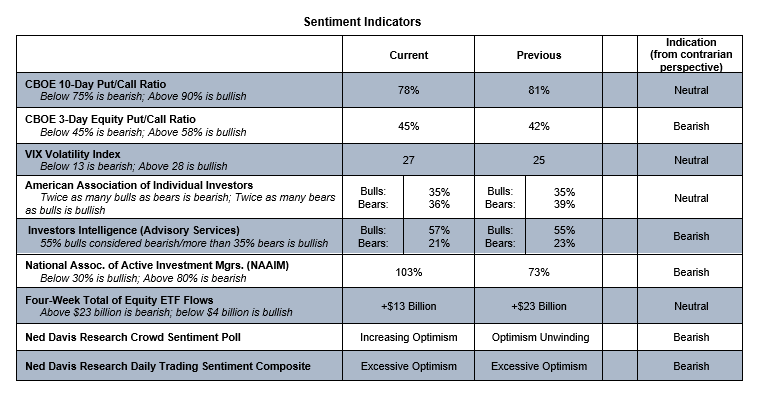
Investor Sentiment: BEARISH
The data really speak for themselves, but a few things jumped out over the past week. AAII bears are at their lowest level since February, the NDR crowd sentiment poll never saw a full unwind of optimism and has moved back toward the excessive optimism level, and investor sentiment indicators from Consensus and Hulbert have also shown surging optimism in recent weeks. Investors overall appear to be interpreting the volatility of the last few months as evidence of market invincibility and are positioned as such.
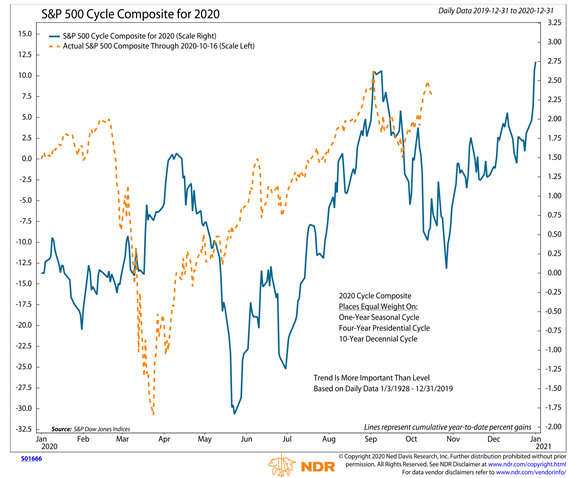
Stock Market Seasonal Patterns / Trends: NEUTRAL
Despite all the attention being paid to the upcoming election, I agree wholeheartedly with these recent sentiments expressed by Michael Santoli (@michaelsantoli) on Twitter: I “still don’t think the election is make-or-break for the market at all. But it’s now the prism through which all market action gets filtered.” From my perspective this likely adds to near-term noise, though may not be a meaningful or sustained driver for equities one way or the other. Polling data and betting markets favor Biden at this point, while equity market performance in recent weeks would be consistent with incumbent re-election. Looking at the S&P 500 Index cycle composite chart, stocks typically enjoy a relief rally in the wake of an election regardless of who wins. While not discounting that in the current case, there is plenty of time between now and election day for the roller coaster ride that has been 2020 to continue to churn investor stomachs.
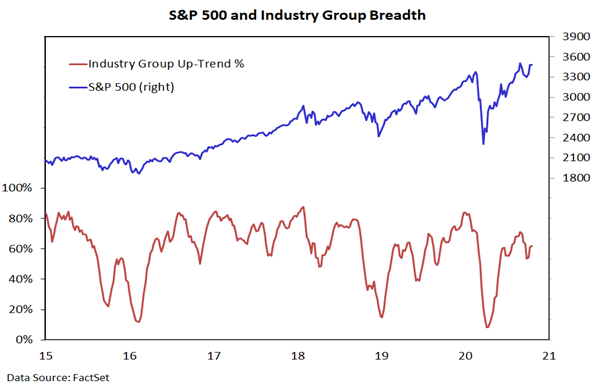
Market Breadth: BULLISH
New highs are expanding, breadth thrusts are firing (the overwhelming attention being paid to the recent breadth thrusts makes me tad uncomfortable) and both our industry group and sector-level trend indicators have turned higher. These suggest that the cyclical rally off of the 2020 lows remains intact. There are some chinks in this armor that bear watching – favorable resolution would add strength to the bullish case. Currently only 43% of world markets are trading above their 50-day averages. While all of the net gains in US stocks over the past 40+ years have come when this has been above 40%, none of the gains over the past three years have come when this is below 70%. The most recent rally in the US has not drawn in global participation to the same degree as earlier in the year.
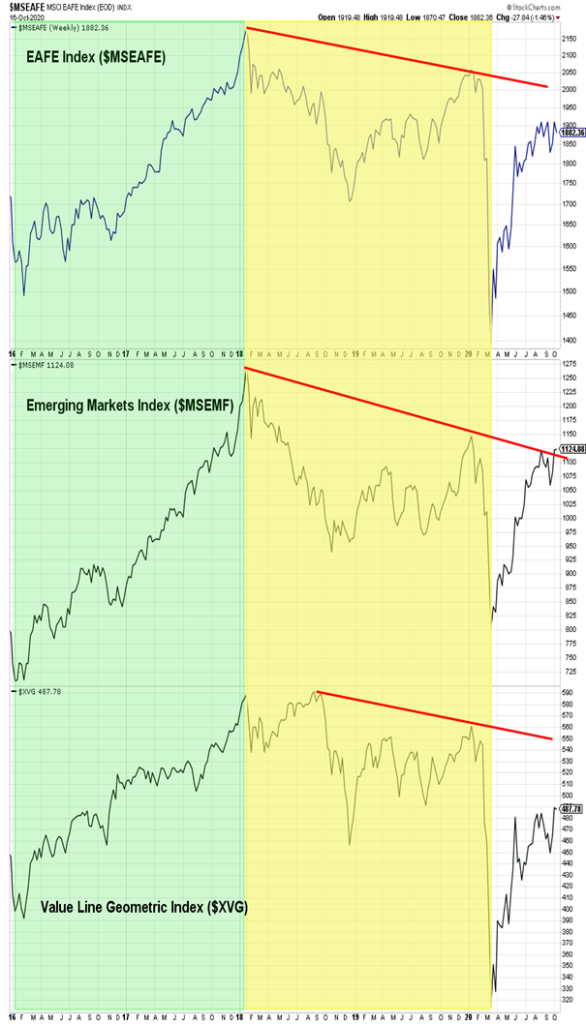
On a domestic basis, the Value Line Geometric Index has thus far failed to surpass its June peak on a daily closing basis. This 490 level has been pivotal for the index in the past and is serving as resistance in the current case. The pattern is a bit more encouraging on the weekly chart (modestly higher highs since June), but the longer-term pattern of lower highs (seen also on the EAFE and Emerging Markets indexes) remains intact. The industry group trend indicator also bears watching – its September peak was shy of its January peak (suggesting a divergence between it and the S&P 500) and it followed that with a lower low. If current strength fails to produce a meaningful expansion in industry groups up-trends, the strong breadth argument would take a meaningful hit. For now there is evidence that the cyclical up-trend may not yet be exhausted but secular cycle questions have not been put to rest.
The Bottom Line
The September peak in the S&P 500 has an almost magnetic pull and the feeling that stimulus is inevitable may help stocks may attempt to work higher in the near-term. The evidence, however, argues against chasing rally attempts as strength would be easier sustain if optimism and valuations are not already at excessive levels. Volatility has been a key feature of the market in 2020 and that does not appear to be changing anytime soon. In terms of what’s next – on the positive side, getting past the election could help turn seasonals more favorable and unwinding optimism (either through volatility or weakness) would lead to an improved sentiment backdrop. The risks are that rally participation narrows and/or a lack of stimulus or other headwinds weigh on economic activity and thus raise the risk of a double-dip recession.
Twitter: @WillieDelwiche
Any opinions expressed herein are solely those of the author, and do not in any way represent the views or opinions of any other person or entity.


