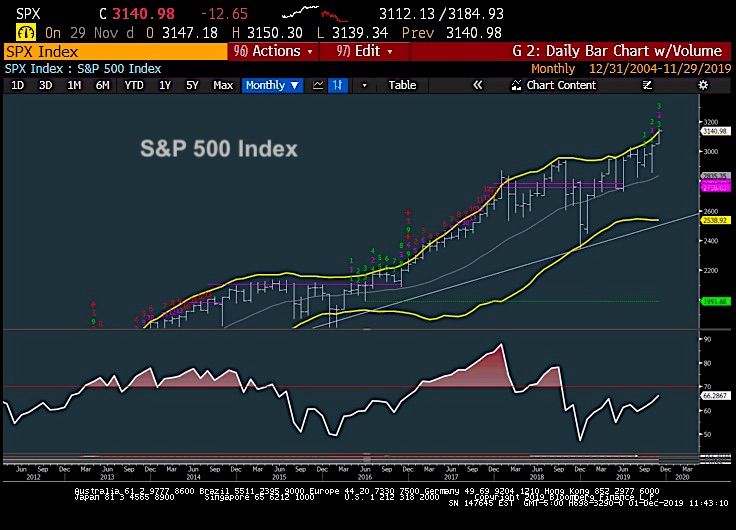
The S&P 500 “monthly” chart shows the extent of how far this year’s 25 percent rally has come.
And what it may mean for stocks in 2020.
The S&P 500 Index has exceeded the highs of its monthly 2 percent Standard Deviation Bollinger Band.
As discussed in our prior report the following has materialized:
For now, it’s thought that weakness could be limited near-term to 3060-5 and could allow for a push up to 3150-60 which would allow for counter-trend exhaustion to trigger again, but also result in near-term negative momentum divergence given last week’s decline. (i.e. price are moving higher, but momentum is not following suit) Rallies into 3150-60 into end of month, would be used as selling opportunities for at least a drawdown to test the area of the breakout back near 3027.
Well, prices are now approaching this area and the month of November has come to a close. The following appear to be risks to this current rally continuing unabated into year-end, and should be noted as Negatives:
1) Smoothed breadth gauges slowing throughout the month, similar to both July and September (McClellan’s Summation Index)
2) Negative Momentum divergence- Momentum has stalled out since 11/6 and momentum gauges like MACD are at lower levels than 11/6, showing negative momentum divergence
3) Overbought- Markets reached the highest overbought levels since January 2018
4) Treasury yields have diverged massively with stocks since 11/6 as stocks and bonds have trended in unison. Given correlation trends in the last year, it’s thought that one of these moves is likely wrong and will reverse
5) Counter-trend Exhaustion signals now present, not unlike what was present back in July. We’ve seen a plethora of upside exhaustion based on Demark indicators, and Tom Demark himself just made a public “sell call for the market
6) Sentiment has reached optimistic levels as the many of the reasons for concern have been shelved
7) Transports, Small-caps and Mid-caps have all underperformed since 11/6
8) The VIX just hit new multi-day highs last Friday, confirming its own counter-trend exhaustion “Buy” in the process
9) Consumer Staples has broken back out to new highs and has outperformed Consumer Discretionary over the last 1, 3 and 6 month periods
10) Multiple indices are now nearing important resistance, such as XLF up to January 2018 peaks
11) Asia seems to have taken a bit step lower last Friday, potentially kicking off a minor global pullback, as China, Hang Seng, Taiex and KOSPI all made technically bearish one-day moves (in some cases breaking 3 month uptrends)
12) Chance that a China deal does NOT get completed and Trump walks a hard line on China with tariffs being put in place by 12/15 without delay
Positives:
1) Market now up +25.76% for the year going into the seasonally bullish month of December. While a 5% correction is possible over the next couple weeks, the month as a whole likely is positive.
2) NYSE “All-Stocks” Advance/Decline is back at new all-time highs, so despite the minor churning in smoothed breadth since early November, overall breadth is still healthy
3) Seasonality is a positive for the month of December and markets are higher nearly 90% of the time
4) IWM breakout has helped Small-caps start to play catchup and considered a bullish move technically in exceeding former highs to reach new highs for 2019
5) Technology remains an outperformer, despite some minor churning in Semiconductors and Software in recent months. Tech has been the top performer in the last month and 6 months along with YTD basis and 2nd overall over the last 3 months. Given that this is 22% of the SPX, it remains a positive for the market
The Bottom Line: While the trend is positive, the weight of the evidence is starting to favor the Bears in terms of near-term risk/reward. Yet, it’s thought that weakness should prove minimal for indices until January. Any weakness, if it occurs in December, should occur over the next two weeks.
However, declines down to the area of this past month’s breakout, i.e. 3027, should prove to be chances to buy dips, for now, and the weight of the evidence to the uptrend from October still favors December late month rallies, until proven otherwise.
If you have an interest in seeing timely intra-day market updates on my private twitter feed, please follow @NewtonAdvisors. Also, feel free to send me an email at info@newtonadvisor.com regarding how my Technical work can add alpha to your portfolio management process.
Twitter: @MarkNewtonCMT
Author has positions in mentioned securities at the time of publication. Any opinions expressed herein are solely those of the author, and do not in any way represent the views or opinions of any other person or entity.


