Tesla’s stock (TSLA) continues to capture the imagination of investors.
TSLA has a long history of being a heavily shorted (and doubted) stock, mostly due to valuations. But the short-sellers added fuel to the fire, with the stock rallying in one year from sub $200 to over $1700 (and now at $1500).
That said, the fact that the company (and stock) are getting attention, and Elon Musk continues to push innovation and forward thinking with Tesla Motors and Space X, I think it’s good for our culture.
Okay, back to the stock. And, more importantly, the stock’s trend and price action. Two weeks back, I wrote about a notable nearly $300 intraday reversal in TSLA’s stock price. Today I provide a brief update and how the dynamics of time and price are (and may be) playing out.
Note that the following MarketSmith charts are built with Investors Business Daily’s product suite.
I am an Investors Business Daily (IBD) partner and promote the use of their products. The entire platform offers a good mix of technical and fundamental data and education.
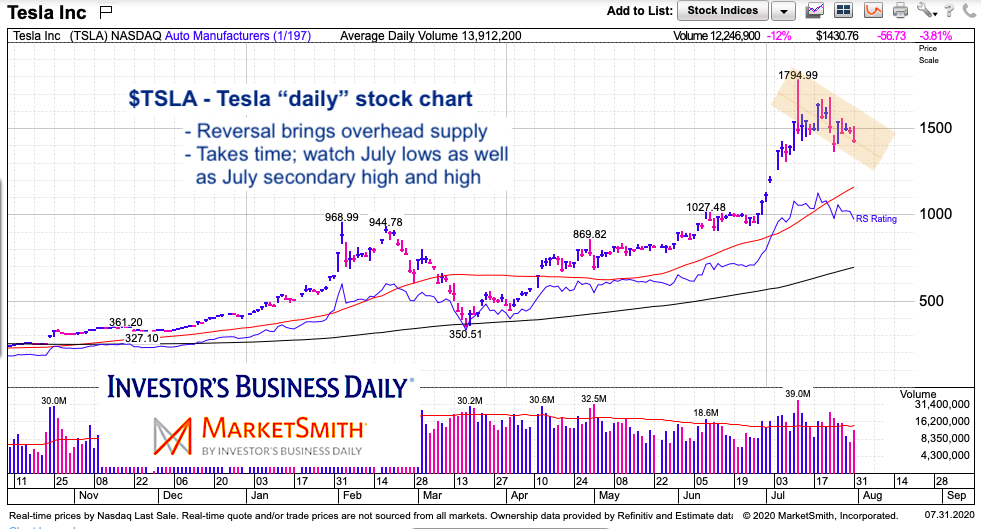
Tesla (TSLA) “daily” Stock Chart
As I mentioned in my July 19 article on Tesla, the price reversal is much more pronounced on the “daily” chart than the “weekly” chart. This means that it is likely to be weighed down by overhead supply (ie. sellers) over the near-term. The price reversal caused a change in psychology that will only be healed if the stock can remain in consolidation without a major breakdown – that means a consolidation via time instead of price. Time and price have a distinct relationship. A stock will either correct by price (more sharply), by time (longer consolidation), or some combination of both.
That said, the July 24 lows are now in focus and the next line of defense for bulls. A break below would likely target the 50-day moving average. On the upside, bulls need to retake the secondary high from July.
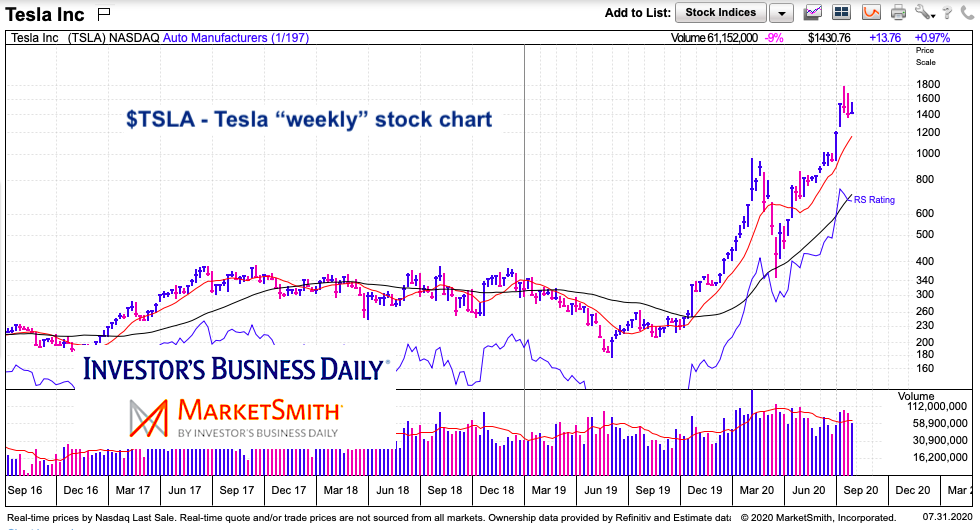
Tesla (TSLA) “weekly” Stock Chart
This gives a better look at the intermediate-term for investors. The reversal is somewhat muted on the “weekly” chart. With the sharp rally, the current pullback looks like a flag formation. This isn’t to say I’m bullish on it (the stock is definitely overbought) but the uptrend is in place and there’s been little technical damage to the “weekly” chart. Watch the 10-week moving average (near-term) and 40 or 50 week moving average longer term.
Twitter: @andrewnyquist
The author may have a position in mentioned securities at the time of publication. Any opinions expressed herein are solely those of the author, and do not in any way represent the views or opinions of any other person or entity.


