Tesla (TSLA) has been red hot this year. Like nearly off-the-charts red hot.
There are plenty of valuation arguments but as an active investor, I follow price. Or better said, the trend. And we can follow a trend on any time frame.
In today’s chart brief, I take a quick look at Tesla’s stock rally on a “daily” and “weekly” basis.
Within any trend, active investors need to manage the trade (exposure) and be aware of technical warning signs. Today, we look at both.
Note that the following MarketSmith charts are built with Investors Business Daily’s product suite.
I am an Investors Business Daily (IBD) partner and promote the use of their products. The entire platform offers a good mix of technical and fundamental data and education.
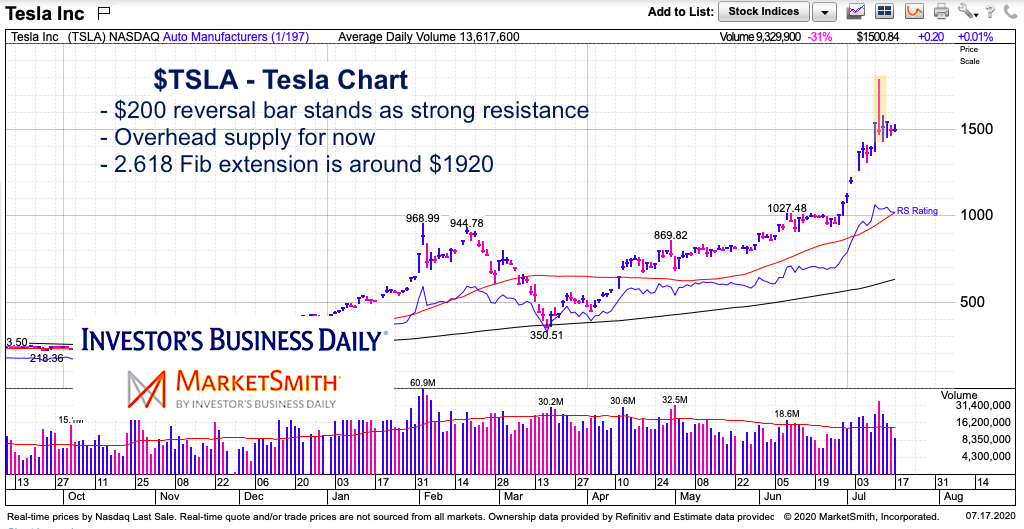
Tesla (TSLA) “Daily” Stock Chart
As I mentioned, traders can follow the trend on any timeframe (15Min, Hourly, etc)… but today we look at “daily” and “weekly”. The burst higher last week was a part of an 800 point run in a matter of weeks… a reminder that anything can happen… and to have your “sell” orders in or your brain in fast-thinking mode so you can take advantage of blow-off type moves.
As you can see, Tesla had already rallied over 500 points in a few weeks so rallying another 200+ points intraday was a big move. That opportunity was quickly gone, though, as the stock reversed lower 200+ points and closed near the lows. That’s a bearish reversal. This is a warning to manage positions within the trend. On the surface, the trend is in tact, but the reversal creates a lot of overhead supply that could limit upside near-term.
Bulls would like to see some further consolidation within the price bar and a breakout that follows. Might be a tall order, but they’ll need it if they hope to hit the 261.8 Fib target any time soon.
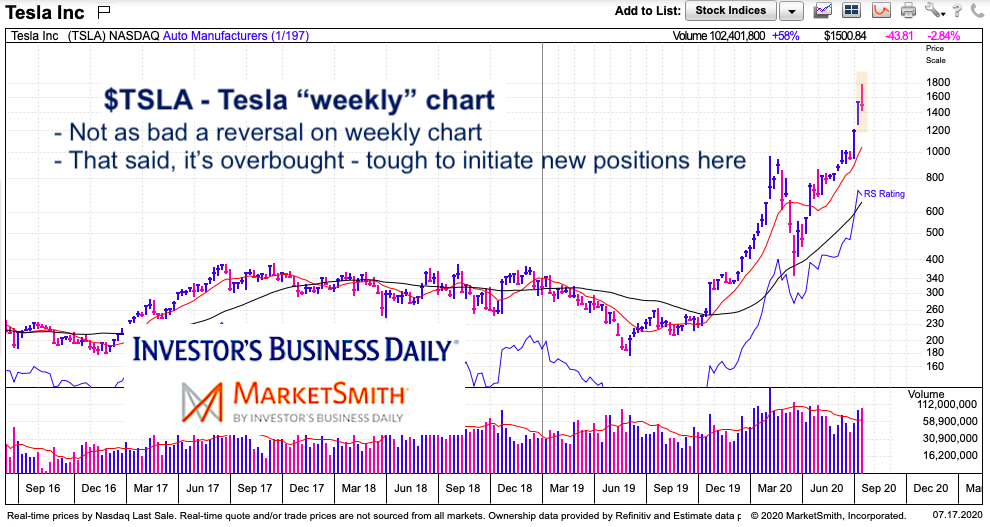
Tesla (TSLA) “Weekly” Stock Chart
The “weekly” chart highlights the steep rally from the 2020 lows. But the reversal doesn’t look quite as prominent on the weekly chart.
That said, the stock is trading 50 percent above its 10 week MA and is extremely overbought. This makes it extremely tough to initiate new positions unless it is on a very short-term trading basis.
Twitter: @andrewnyquist
The author may have a position in mentioned securities at the time of publication. Any opinions expressed herein are solely those of the author, and do not in any way represent the views or opinions of any other person or entity.

: Showing Some Signs of Emerging Strength")

