Equities, Economics, And Geopolitics In 2018… For Your Consideration
There were a lot of news headlines, happenings, and "all-times" in 2017.. Now it's 2018.
Let's turn the page and get some perspective on the...
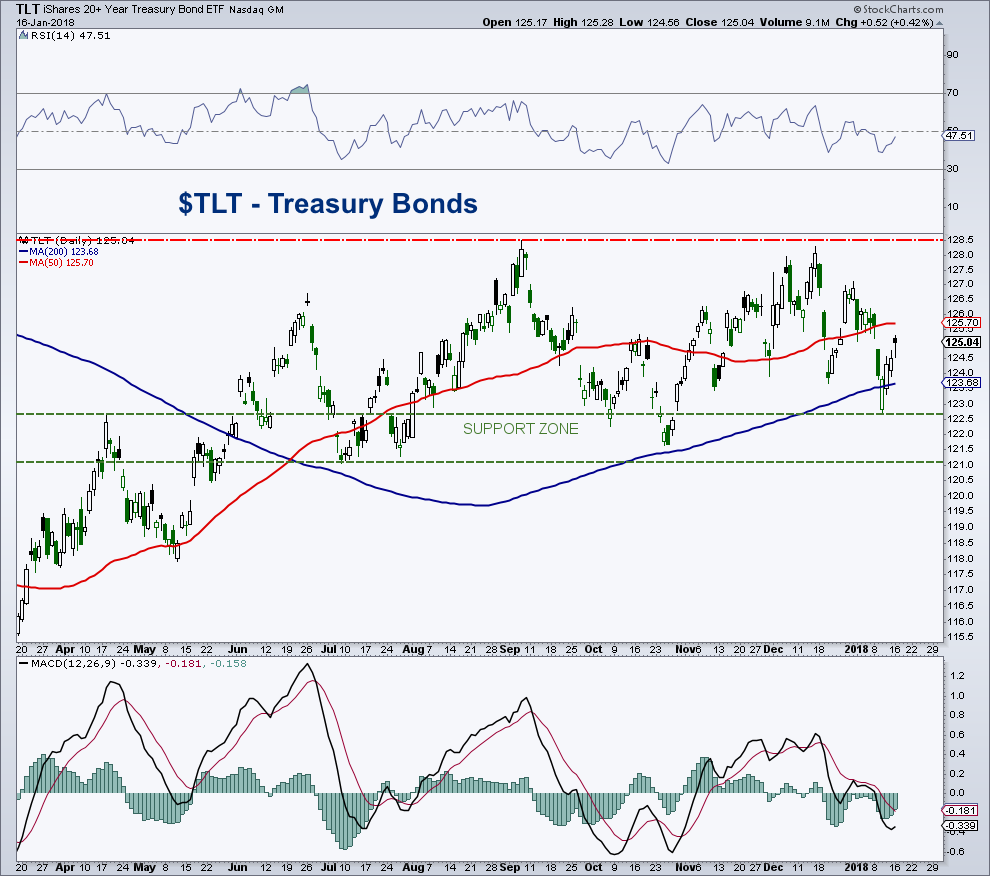
Treasuries Update (TLT): Bond Bulls Have Work To Do
iShares 20+ Year Treasury Bond ETF (TLT)
On the daily chart (shown below), TLT remains extremely subdued, showing little change over the past seven months....
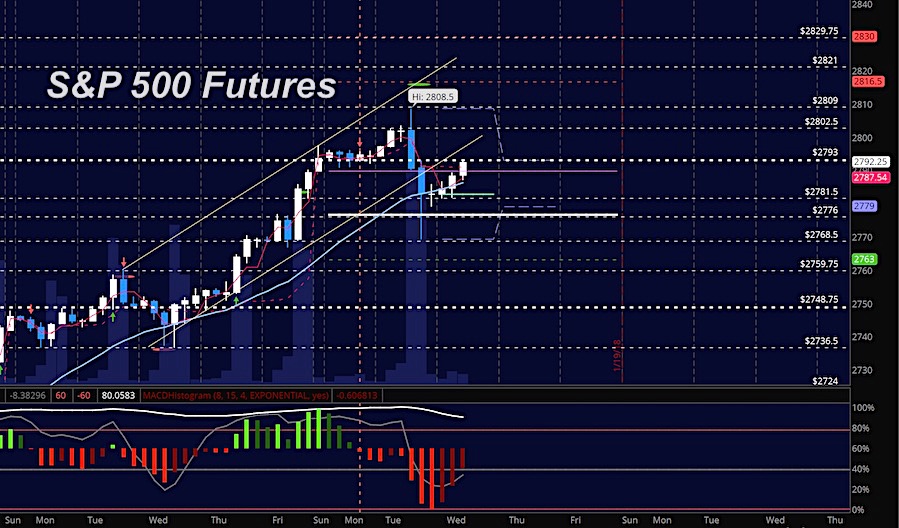
Stock Market Futures Trading Outlook For January 17
Stock Market Outlook for January 17, 2018
Technical divergence wins the intraday motion but buying on pullbacks still viable - buying on pullbacks still provides the...
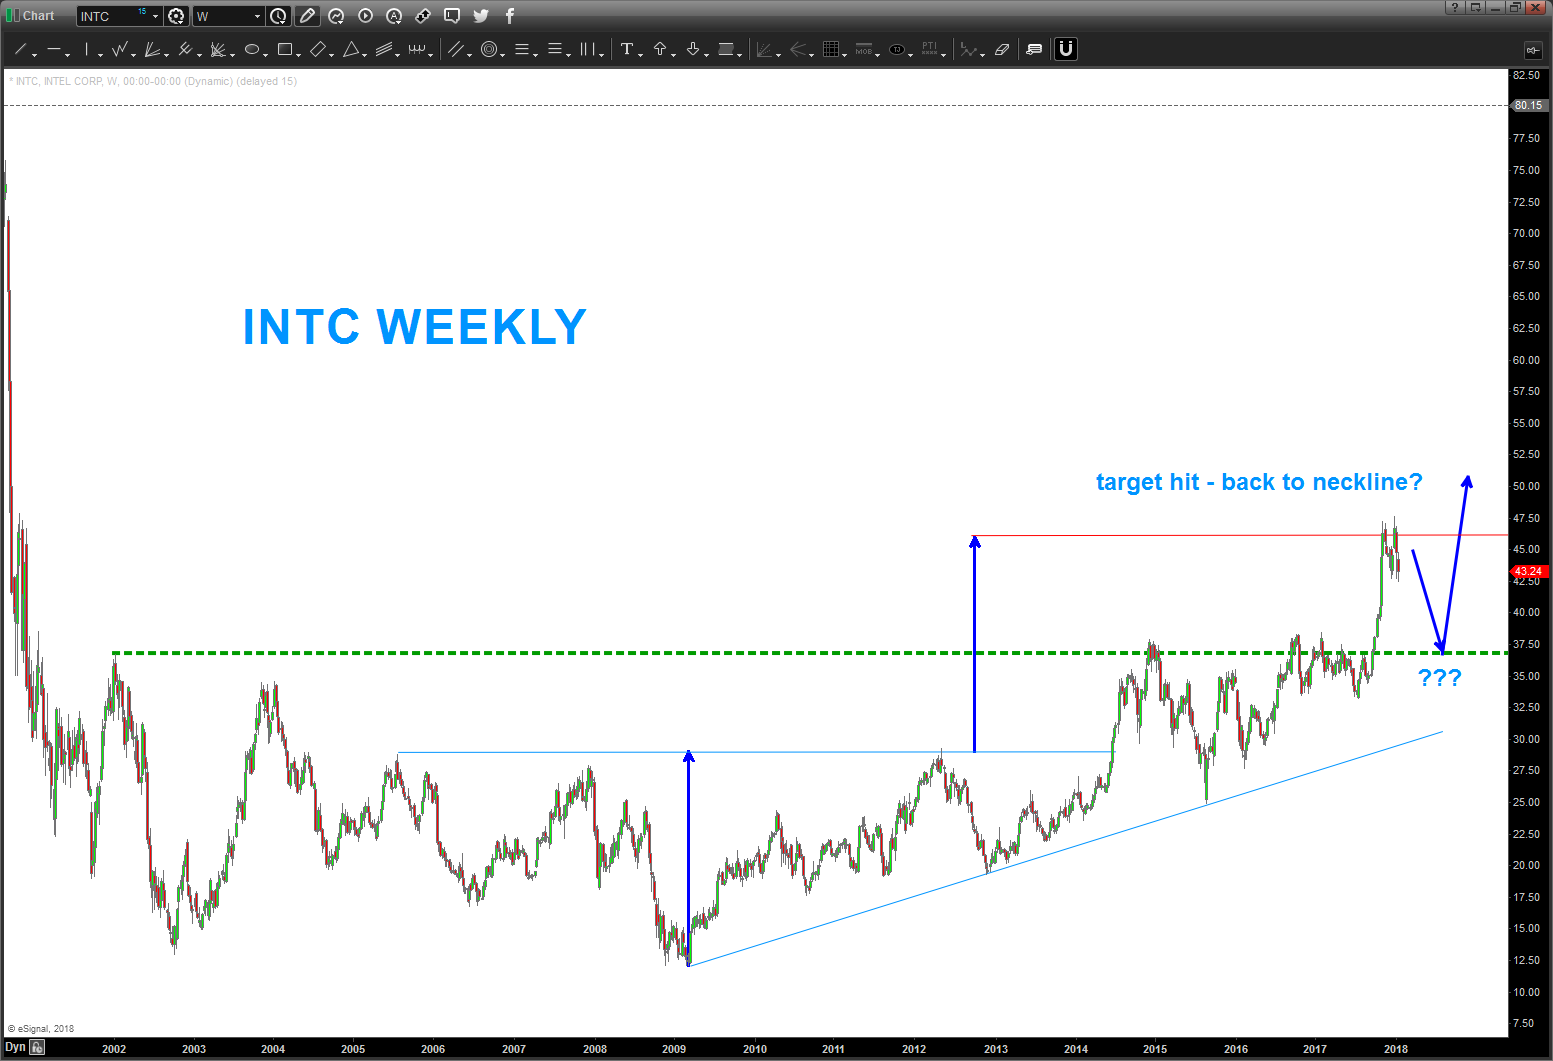
Intel Stock (INTC): Should Investors Buy This Pullback?
For several months now, we have been bullish on Intel (INTC). But understanding the "swings" is equally important when managing positions & risk.
Back in...
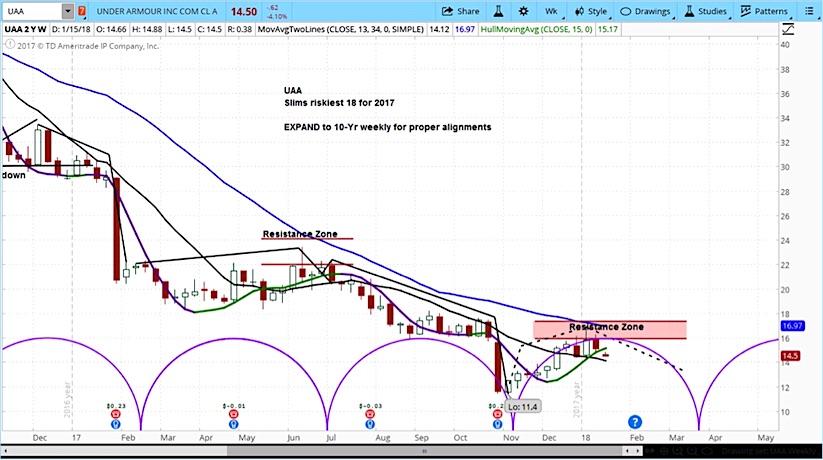
Under Armour Stock Falls 8 Percent On Analyst Downgrade
Under Amour's stock price (UAA) is getting hit hard on Tuesday, trading lower by as much as 9 percent in Tuesday's trading session.
The immediate drop...
4 Prevalent Investor Biases And How To Manage Them
If you had to analyze every decision you make on a given day, you probably wouldn’t get much done. You might not even make...
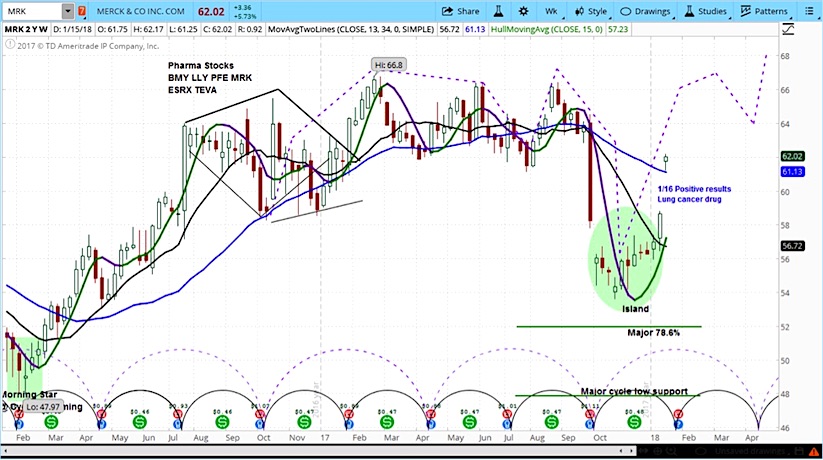
Merck’s Stock Jumps Over 5 Percent On Keytruda Trial Results
Merck (MRK) jumps over 5%
Shares of Merck (MRK) rose after positive results on trials of its Keytruda lung cancer drug.
This stock move has...
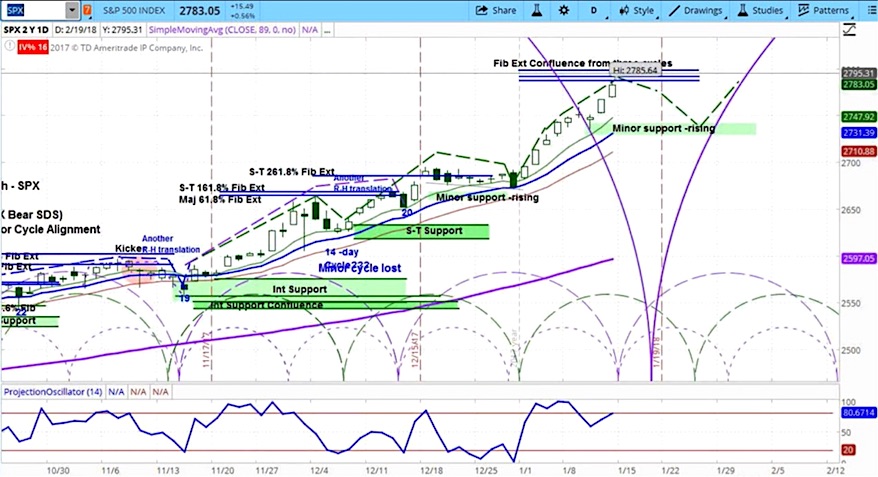
S&P 500 Weekly Outlook: Market Cycles Point To A Pullback
The stock market has been "off to the races" to start 2018, as the S&P 500 is testing the 2800 price level.
Stock prices continue...
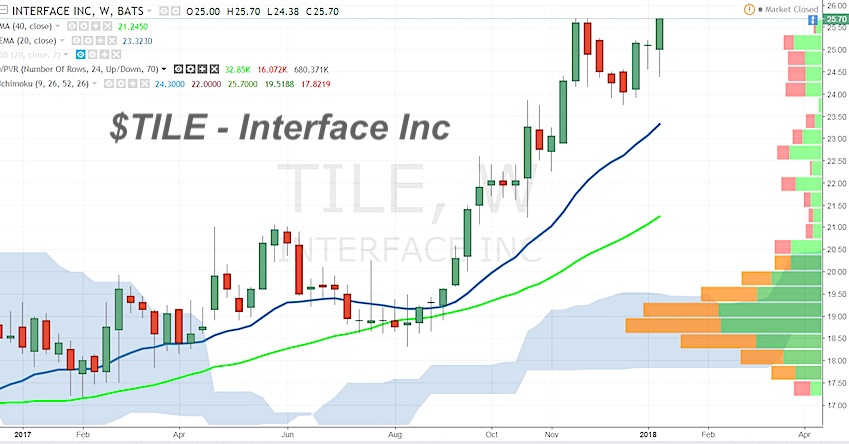
Interface (TILE): Strong Combination of Fundamentals and Technicals
Interface Inc (TILE)
Interface is a $1.54B maker of modular carpet for commercial and residential markets trading 19X Earnings, 1.59X Sales and 41.83X FCF with...
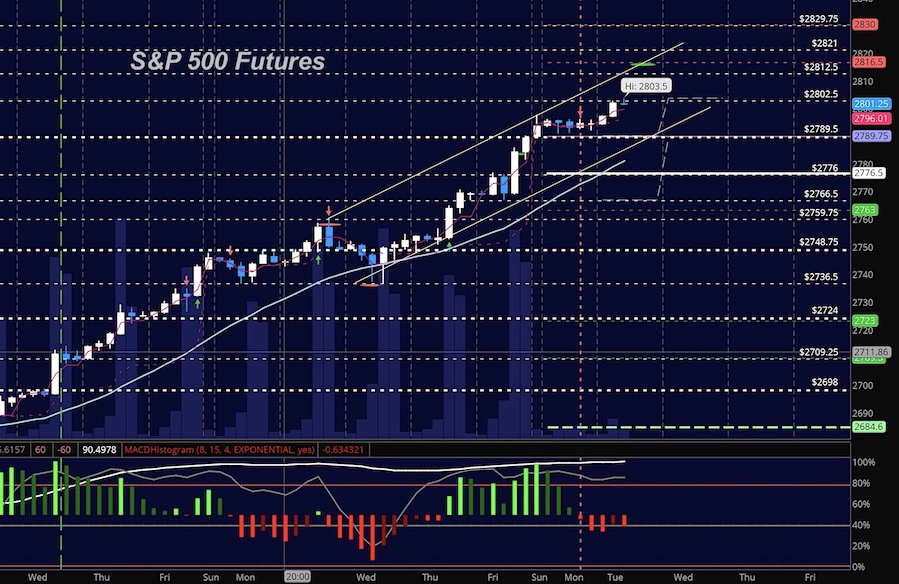
Stock Market Futures Trading Update: Watch Those Divergences!
Market Outlook for January 16, 2018
The S&P 500 and broad market indices are seeing some bullish continuation after the long holiday weekend. However, there is...


